when trying to display data using the trackball, the tooltip is clipped on left at chart start:
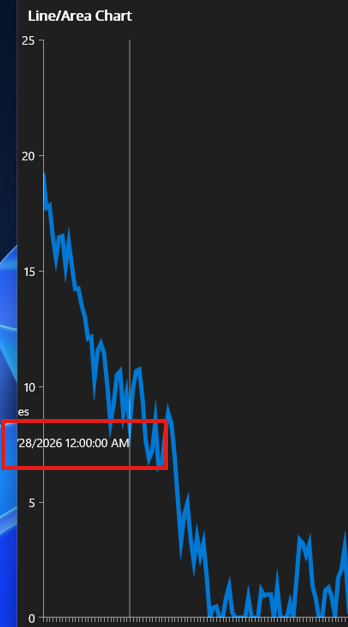
when having a chart with horizontal datetime axis and trackball behavior, the first and last points are not displayed in the trackball
when using categorical axis, the last point displays in the tooltip, but the first point does not.
Currently to achieve this I have to access the native chart and apply a gradient on the native chart series fill and stroke on iOS/Mac
on WinUI I have to define a new template for the series PointTemplate. and set the color.
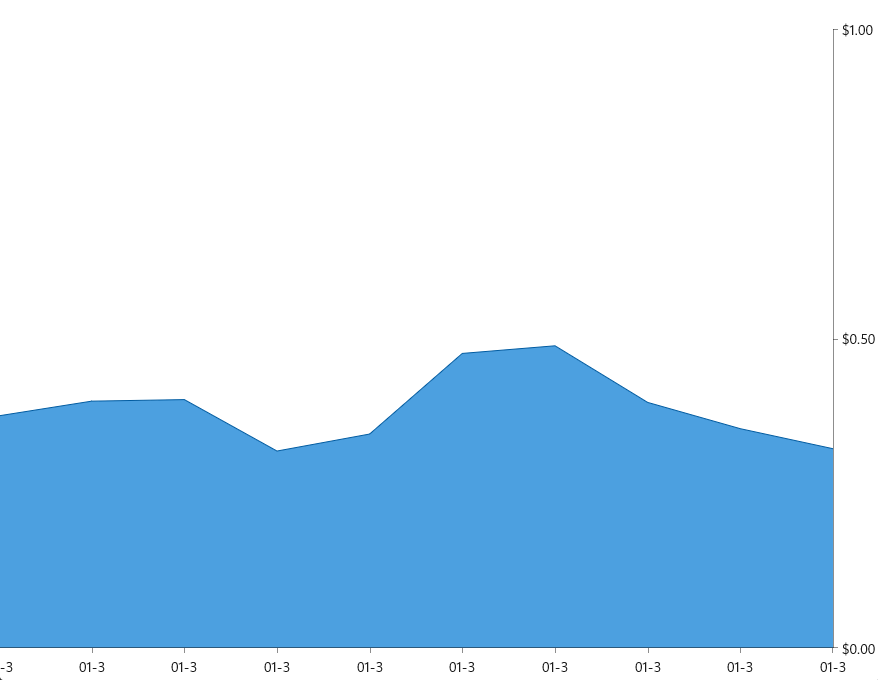
Last label on the x axis is clipped, when the y axis is right positioned and x axis plot mode is on ticks.
when using the flowing setup:
<telerik:RadCartesianChart.ChartBehaviors>
                    <telerik:ChartSelectionBehavior x:Name="selection"
                                                    SeriesSelectionMode="None"
                                                    DataPointSelectionMode="Single"
                                                SelectionChanged="selection_SelectionChanged"/>
</telerik:RadCartesianChart.ChartBehaviors>
the selection behavior on data point does not fire on iOS/MacCatalyst on Cartesian series. It works for PieSeries.
when rendering thousands of data, provide fast line chart. This type of series can be used for system performance monitoring or with chart than need to display thousands data points.
WinForms has fast line chart: https://docs.telerik.com/devtools/winforms/controls/chartview/series-types/fastline
NullReferenceException when Chart is added inside Microsoft MAUI CollectionView and navigating back to a page.
Workaround:
When using the Telerik MAUI CollectionView no exception.
Add an option to define chart title.
Currently we can achieve this by adding a label on the top/bottom of the chart.
Example:
<Grid RowDefinitions="Auto,*">
    <Label Grid.Row="0" Text="Chart title"/>
    <telerik:RadCartesianChart x:Name="chart" Grid.Row="1" AutomationId="chart">
        <telerik:RadCartesianChart.BindingContext>
            <local:ViewModel />
        </telerik:RadCartesianChart.BindingContext>
        <telerik:RadCartesianChart.HorizontalAxis>
            <telerik:CategoricalAxis />
        </telerik:RadCartesianChart.HorizontalAxis>
        <telerik:RadCartesianChart.VerticalAxis>
            <telerik:NumericalAxis />
        </telerik:RadCartesianChart.VerticalAxis>
        <telerik:RadCartesianChart.Series>
            <telerik:BarSeries CategoryBinding="Category"
                                ValueBinding="Value"
                                ItemsSource="{Binding Data}" />
        </telerik:RadCartesianChart.Series>
    </telerik:RadCartesianChart>
</Grid>