Hi Team,
I would like to request adding Swimlane Orientation for the Kendo UI Diagram.
Thank you!
Enhancement
Expose renderAs property in Diagram as it is in Chart
TicketID: 1563168
Environment
Kendo UI version: ]all]
Browser: [all]
Hi Team,
I'd like to request the functionality to inject HTML code using the Kendo UI Drawing API. Specifically, being able to utilize a Node Container with the Drawing API would be great.
Thank you!
Hi Team,
I'd like to request the Kendo UI Diagram to include a double click event in future releases similar to the click event.
Thank you
Add ability to define connection visual template option for the whole connection path. In this way the user can define custom connection types (like 'polyspline' ).
Someting like:
Hi,
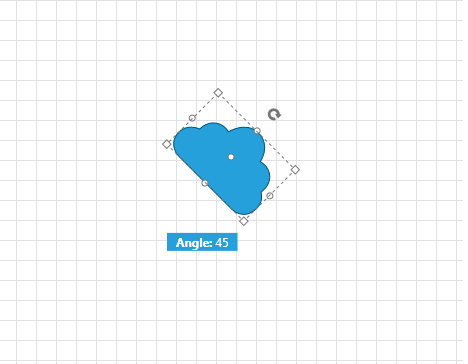
Your documentation mentions the rotation-thumb and also allows for some styling:
https://docs.telerik.com/kendo-ui/api/javascript/dataviz/ui/diagram/configuration/editable.rotate
The only problem is, I cannot get it to display.
See: https://jsfiddle.net/6qmgj521/
Beware: I do NOT mean the 90 degree rotation buttons in the toolbar, but the rotation-thumb adorner!
I expect to see:
Kind regards,
Hans van Essen
The data item is available to the event arguments of the function handler for shapeDefaults.content.visual function but it is not available to connectionDefaults.content.visual Function. Here is an example illustrating the issue: https://dojo.telerik.com/EMAzeruG
Can it be added?
Fish Bone diagram is a nice feature which is very useful for the applications to provide the root cause analysis in any vertical.
Syncfusion is having a nice in built control to do the same.
https://ej2.syncfusion.com/demos/diagram/fishbone-diagram/
A similar feature from Kendo UI is needed to include it in our existing applications.
Hi,
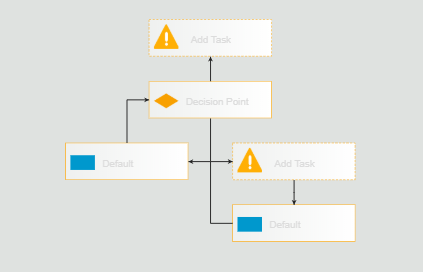
I have to design the flow chart as below using the kendo diagram.
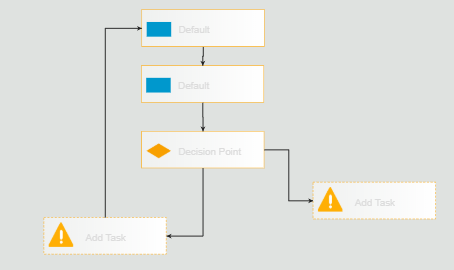
After dragging the connection from bottom shape (Add task) to top shape (Default) as per the requirement it is showing like below. Actually both are same but the design look & feel is completely changed. i want to see the flowchart as like above one. Kindly provide solution for this.
Thanks,
Bhanu N
It should be allowed to extend the Diagram plot area to more than 20000px and/or to calculate the max scroll width based on the Diagram content.
While the Diagram component is nice it is not explicitly constrained to OrgChart behavior with custom drill-up and built-in drill-down capability like the control for the ASP.NET AJAX suite has and thus trying to implement it as such would consume too much time. The Diagram component is amazing and certainly has valid use cases but to extend it for use as an OrgChart with all the behaviors that exist in the pure AJAX control would be a pain.
SVG Example:

            <svg>
                <defs>
                    <pattern id="Occupied"
                            width="4" height="10"
                            patternUnits="userSpaceOnUse"
                            patternTransform="rotate(45 50 50)">
                        <line stroke="#ffb29d" stroke-width="2" y2="10"/>
                    </pattern>
                </defs>
                <rect x="5" y="5"
                      width="40" height="100"
                      fill="url(#Occupied)"
                      stroke="#ff7094"
                      stroke-width="1" />
            </svg>
I save the diagram json to everlive by using the save method and load it into the widget with the load method. My problem is that connection blocks cannot be edited now. I don't think CRUD should be required for this ability.
I find the documentation is critically lacking with regards to the available options for a feature.

Here is an example of what I mean...

http://docs.telerik.com/kendo-ui/api/javascript/dataviz/diagram/layout#configuration-alignContent

The diagram Layout > alignContent feature "Specifies the alignment of the content."

Ok, but the documentation does not even say what the allowed values are. Instead, it just has "alignContent String (default: "start")".

Now, I guess the allowed values here are the same values allowed for an SVG text-anchor.
https://developer.mozilla.org/en-US/docs/Web/SVG/Attribute/text-anchor

How about adding those possible values to the api documentation, or including a link to the relevant area of the SVG specification?

Hope this makes sense.
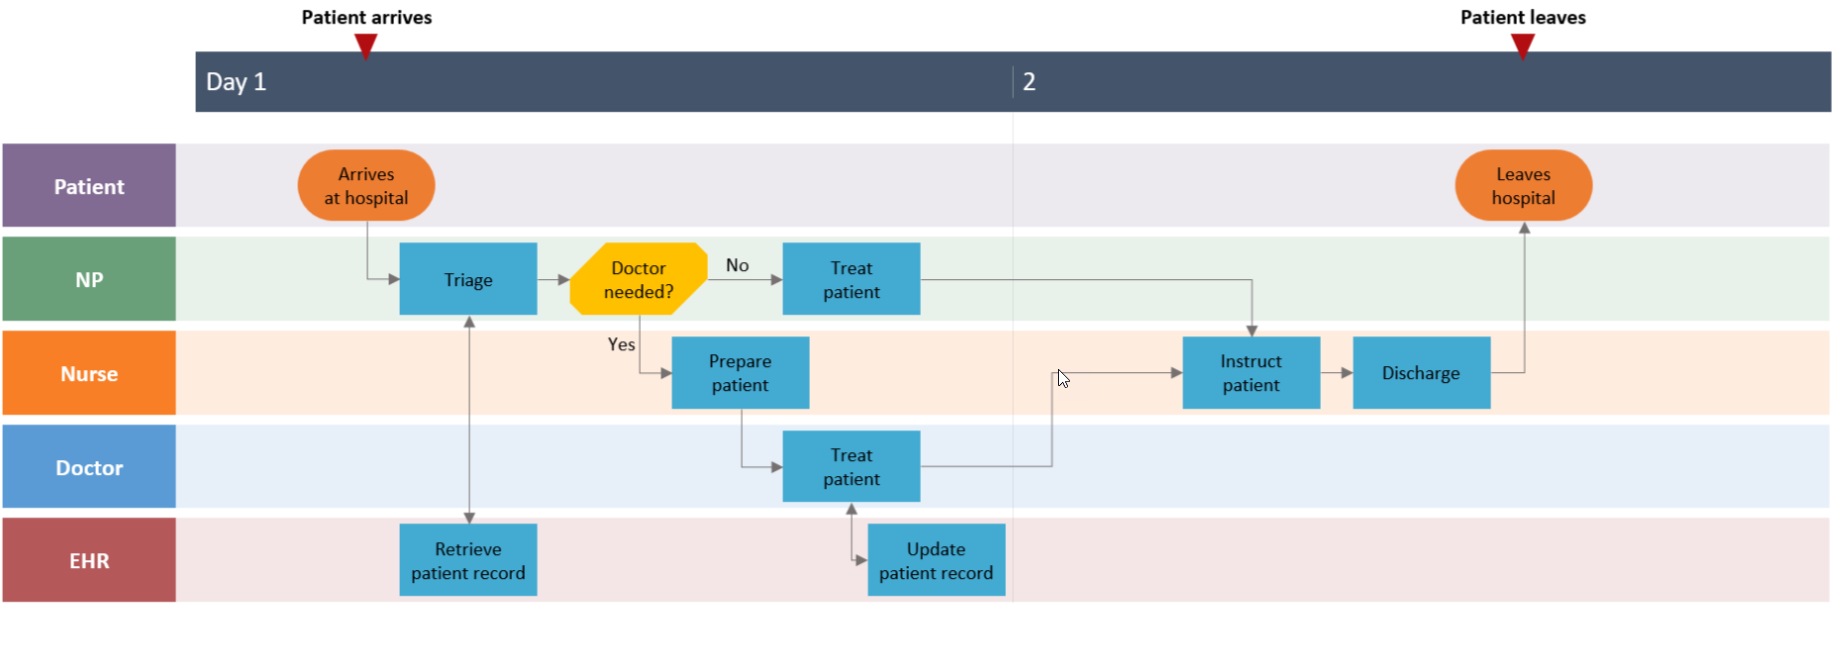
You should include a flowchart demo for your diagram tool. It is possible - somewhat - but you are not even including a demo for it, while vendors like syncfusion do!

The way I found out a flowchart was possible was because of the Kendo UI cookbook and cookbook code files.
https://www.packtpub.com/web-development/kendo-ui-cookbook

Seriously, I don't know why you are not including a demo for a flowchart in your demo list for the diagram tool; this should be a no-brainer to include, and in theory, you should not even have to build anything new, just use the diagram tool you have already made.
It would love to have an export feature for Diagram which will give the possibilty to make an export to Microsoft Visio.
In large Diagrams the connections will route trough the shapes itself what is very confusing. I would like to have an option to avoid this behaviour.
Rad Diagram - Support copy paste from one diagram to another,
Expand/Collapse feature on click of the diagram nodes.
Load data on demand during enpansion of the node.