It would be great if text within the Treelist section of the Gantt chart would wrap.
Configuring the rowHeight increases the height of the table row, but the long text is still not wrapped. Here is a sample dojo demonstrating the current behavior: https://dojo.telerik.com/EtEViREL
An ideal solution would be something that increases the size of the corresponding timeline row to match the treeview row, and to move down things like dependency arrows so it looks like everything still matched properly.
Bug report
While editing a Gantt task name navigating in the input field with a mouse click does not work. Double-clicking on a cell enters edit mode and positions the cursor at the end of the text. Moving the cursor using the mouse does not work while navigating in the input field with the keyboard works.
Reproduction of the problem
- Run this dojo
- Double-click the title of the first task
- Try to click elsewhere in the input field to move the cursor.
Current behavior
Clicking in the input field does not move the cursor to the selected position
Expected/desired behavior
Clicking in the input should move the cursor to the selected position
Environment
- Kendo UI version: 2019.2.619
- Browser: [all]
Reproduction:
- Open https://demos.telerik.com/kendo-ui/gantt/pdf-export
- Click "Export to PDF" and open file
- Actual result: there's a lot of blank space on the right
- Expected result: the margin should correspond to the pdf.margin.right option
I have a gantt chart with tasks, resources, and assignments. I want to enforce a many-to-one relationship between tasks and resources, that is, I want to be able to assign a single resource to any number of tasks, but each task can only have 1 resource at a time. A (conceptually) simple sample implementation would be to change the checkboxes to a radiobutton in the 'assign' dialog window, from the 'edit' dialog.
I understand there is currently no way to enforce this type of relationship or the restrict the user from selecting more than 1 assignment in the assignment dialog window, so I am requesting a way to do either (or both) of these things. I would imagine a setting in the gantt or taskDataSource for enforcing the relationship, or a setting in the assignment field for switching the dialog box to radio button like behaviour.
This would be a great addition to the control. In the meantime, we'll either leave filtering out of our application or try to find a way to recursively gather all of the parent task ids and include them in our service to return tasks that meet the filter criteria.
Thanks for considering!
Ben
Hi,
I am using kendo's Gantt chart. But I unable to achieve few things using the existing Gantt chart features.
Following are the features I request should be provided for Gantt chart:
- Multiple tasks/milestones in a row.
- Multiple rows for a parent task.
- If space is not available in preceding row(s), overlapping tasks should be moved to next row.
- User should be able to provide start date for the quarter in a fiscal calendar. Ex: If user give 01st-June as the start date, then Q1 should start from 01st-June. Hence, quarters will be defined as: Q1(June-Aug), Q2(Sept-Nov), Q3(Dec-Feb), Q4(Mar-May)
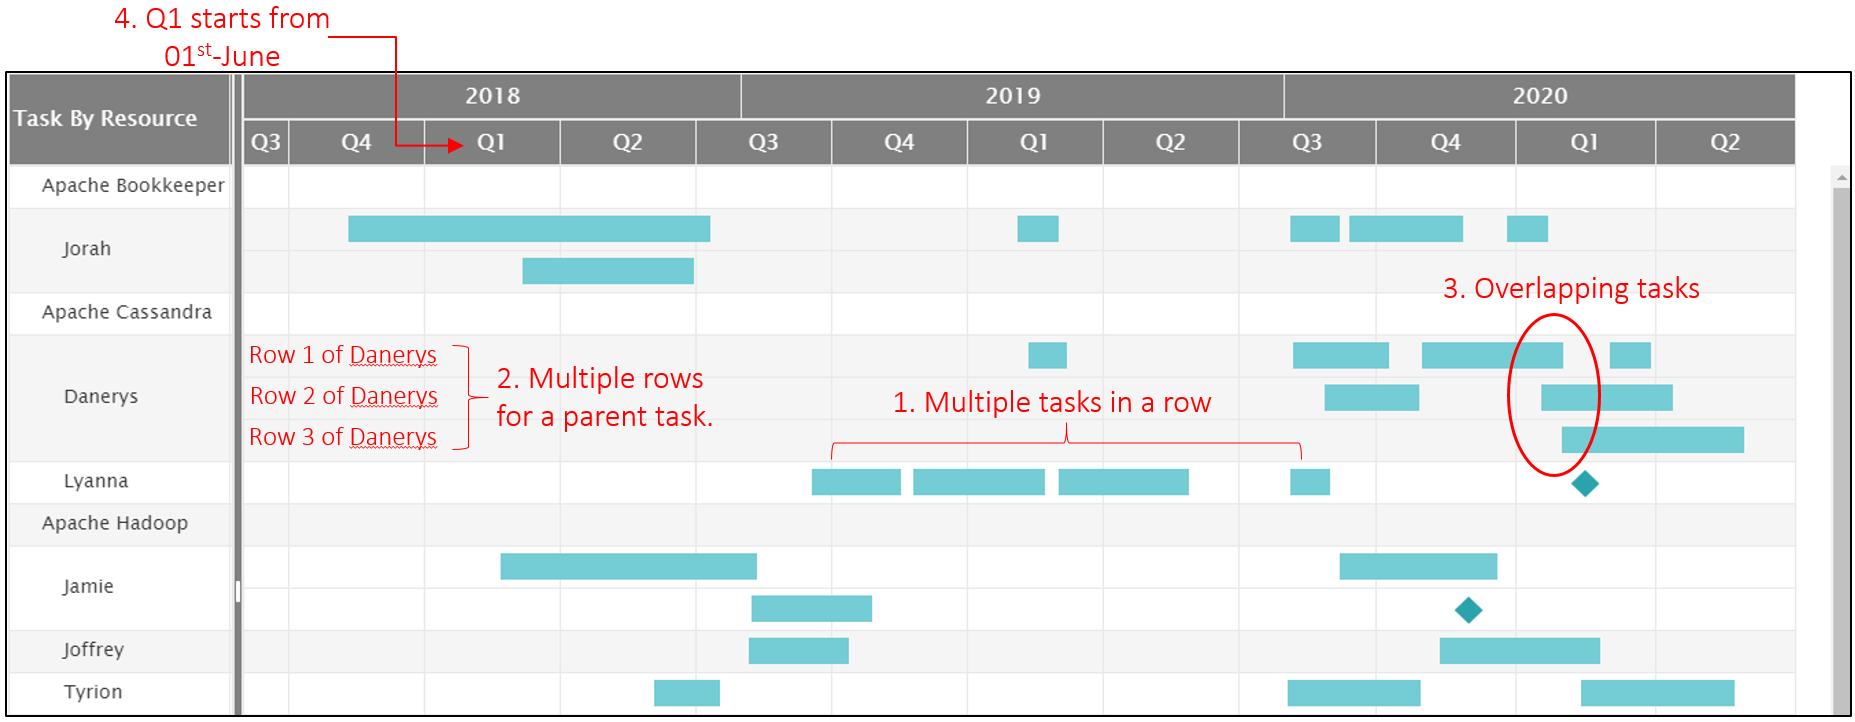
Refer above image for point 1-4
5. If task label is exceeding the width of the task, then height of the task should be increased to accommodate task label(in other words, text should be wrapped). Also, font-size of the text should be responsive, that is, font-size should be reduced to accommodate entire text in minimum task height.
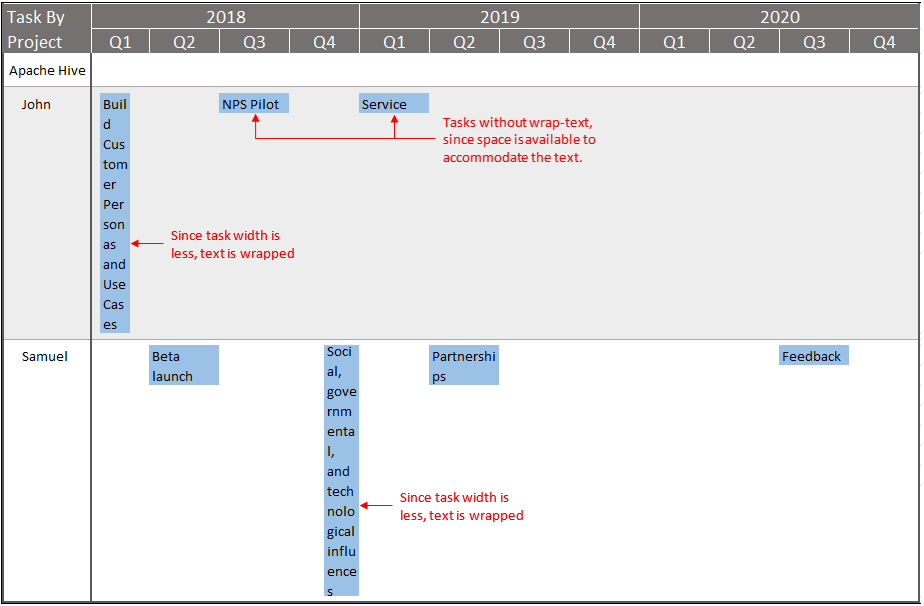
Refer above image for point 5
Implement support for external editor in the Gantt. Instead of using an editor template or calling the editTask method, make possible Gantt tasks to be updated without opening the default editor.
A modification in a child task, e.g. changing its start date, should also update the summary task.
I´m working with Kendo Ui Gantt AngularJS
How to execute the update function and get, again, I need it for a custom function
I need something like that
update ();
get ();
I am Working With Gantt in AngularJs, but I dont found way to make the Critical Path And Baseline in Gantt.
is this possible?
That is a problem for me because, first, it's only a format for the dates and not a full template, and second, there is no option to do the same for the move action.
A working example of the bug is at https://dojo.telerik.com/EPuqExOg with a simple workaround until the bug is fixed.

Currently, the percentage textbox doesn't work when in the German language.

The date textboxes localize ok.
It would be great to have multiple column sort in Gantt view
We currently do not have an option for lazy loading in Gantt.

It will be helpful to have this option for large data (like 10000).

We do currently have a filter functions like range to show the limited data but having loadOnDemand helps for large data.
Currently Task Template and Toolbar Template doesn't integrate with AngularJS. E.g. it is impossible to use {{ $ctrl.mymember }} or <my-angular-component></my-angular-component> for the task template in gantt.
Hour Span should be allowed integer values instead of only number values(currently it takes the floor of any decimal value)
Currently % complete calcs for summary tasks are based solely on the sum of % complete per child task / number of child tasks (x%+y%+z%)/3. In this way, a small scale task of 1 or 2 days has a large impact on summary % complete whereas a large task of 60 days has a small impact. Request is to add in weighting based on duration (end date - start date).