Bug report
Reproduction of the problem
When the diagram is zoomed the click event is not fired when clicking on shapes.
- Open this dojo - https://dojo.telerik.com/iALWmVGY
- Zoom diagram out
- Click on a shape
Current behavior
Click event is not fired.
Expected/desired behavior
Click event should be fired when clicking on a shape in zoomed out diagram
TicketID:
1715835
The documentation of the Kendo-UI Diagram widget specifies the following signature of the zoom method (as do the corresponding TS typings):
zoom(zoom: number, point: kendo.dataviz.diagram.Point): void;However, the JS implementation looks like this:
zoom: function(zoom, options)where options is an object that may contain a field called "point" of type kendo.dataviz.diagram.Point.
When using zoom as documented, it ignores the specified point. This DOJO demonstrates the behavior.
Hi Team,
I would like to request a way to create a Kendo UI Diagram shape with a SVG XML Document.
Thank you!
Hi Team,
I would like to request a way to add Kendo UI Controls to a Kendo UI Diagram similar to the WPF controls to RadDiagramShapes. For example, embedding a circular gauge in a diagram.
Thank you!
Bug report
On Zoom Some Connection lines become bolded
Reproduction of the problem
Dojo: https://dojo.telerik.com/uHOdOHOV/4
Zoom the chart randomly
Current behavior
Some Connection lines become bolded
Expected/desired behavior
Connection lines coordination shall be rounded so they render equally
Environment
Kendo UI version: [all]
Browser: [all]
Hi Team,
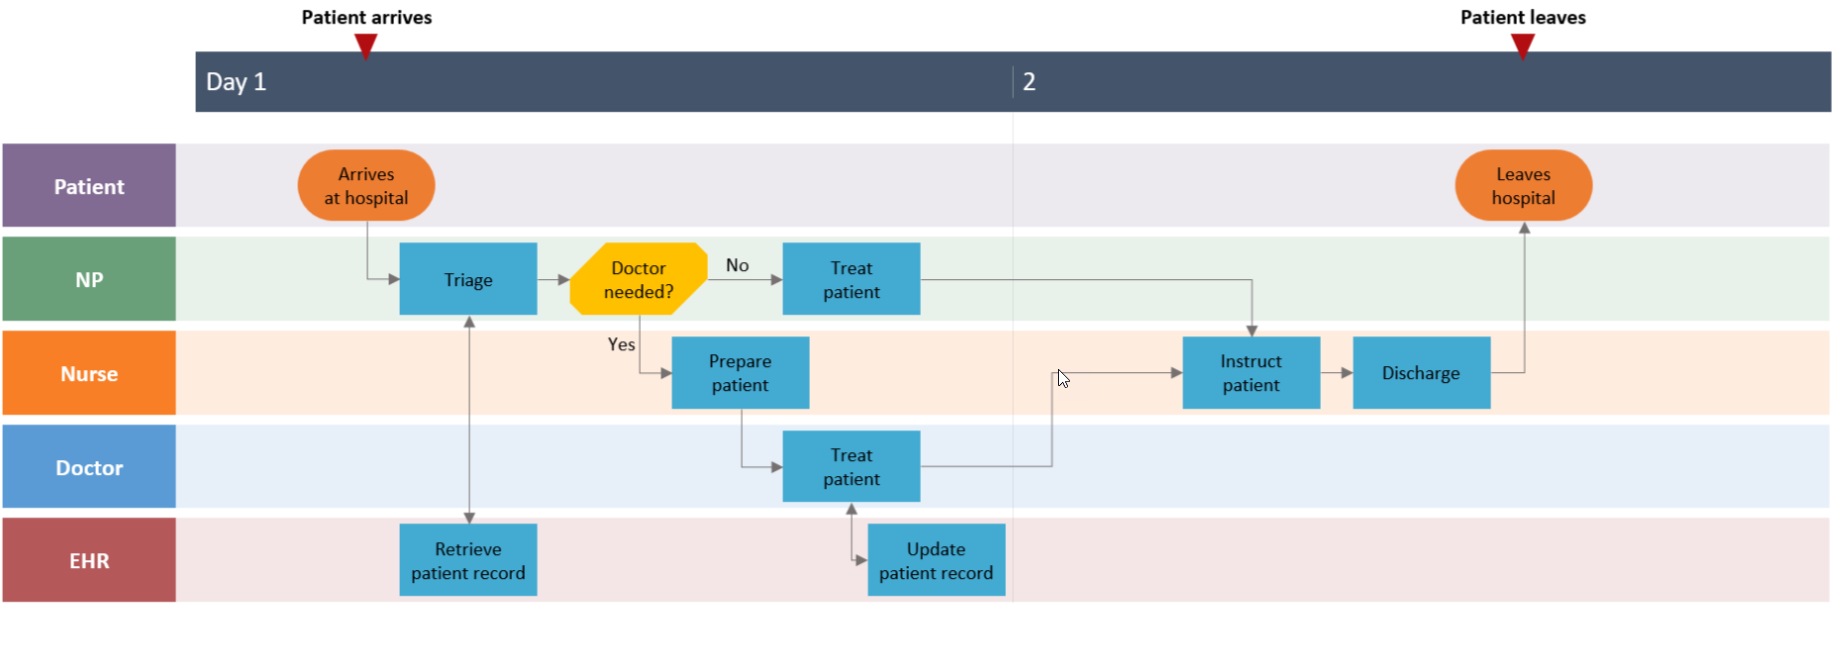
I would like to request adding Swimlane Orientation for the Kendo UI Diagram.
Thank you!
Bug report
In a Diagram, if you have a lot of nested data, a "Maximum call stack size exceeded" error is thrown.
Reproduction of the problem
- Open this example - https://dojo.telerik.com/OcOBaFoq/3
Current behavior
A Maximum call stack size exceeded error is thrown
Expected/desired behavior
No errors should be thrown.
Environment
- Kendo UI version: 2023.3.1010
- Browser: [all]
Enhancement
Expose renderAs property in Diagram as it is in Chart
TicketID: 1563168
Environment
Kendo UI version: ]all]
Browser: [all]
Hi Team,
I'd like to request the functionality to inject HTML code using the Kendo UI Drawing API. Specifically, being able to utilize a Node Container with the Drawing API would be great.
Thank you!
Hi Team,
I'd like to request the Kendo UI Diagram to include a double click event in future releases similar to the click event.
Thank you
I disable the zoom on a diagram by setting the zoom property to 0 and it works.
Unfortunately it crashes the pdf export with the following error:
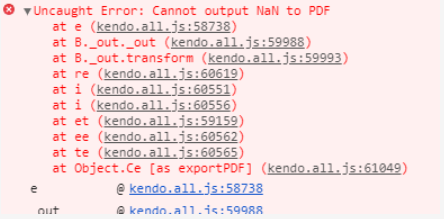
This is a dojo where the issue reproduces: https://dojo.telerik.com/EveCAnAq
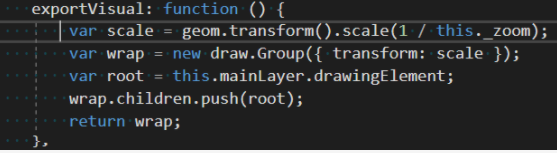
I did a quick investigation in the library and the culprit seems to be the first line of the below function. _zoom is either zero or undefined resulting in NAN.
Add ability to define connection visual template option for the whole connection path. In this way the user can define custom connection types (like 'polyspline' ).
Someting like:
Hi,
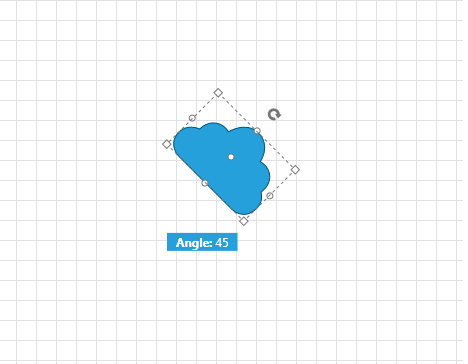
Your documentation mentions the rotation-thumb and also allows for some styling:
https://docs.telerik.com/kendo-ui/api/javascript/dataviz/ui/diagram/configuration/editable.rotate
The only problem is, I cannot get it to display.
See: https://jsfiddle.net/6qmgj521/
Beware: I do NOT mean the 90 degree rotation buttons in the toolbar, but the rotation-thumb adorner!
I expect to see:
Kind regards,
Hans van Essen
The data item is available to the event arguments of the function handler for shapeDefaults.content.visual function but it is not available to connectionDefaults.content.visual Function. Here is an example illustrating the issue: https://dojo.telerik.com/EMAzeruG
Can it be added?
Fish Bone diagram is a nice feature which is very useful for the applications to provide the root cause analysis in any vertical.
Syncfusion is having a nice in built control to do the same.
https://ej2.syncfusion.com/demos/diagram/fishbone-diagram/
A similar feature from Kendo UI is needed to include it in our existing applications.
It should be allowed to extend the Diagram plot area to more than 20000px and/or to calculate the max scroll width based on the Diagram content.
SVG Example:

            <svg>
                <defs>
                    <pattern id="Occupied"
                            width="4" height="10"
                            patternUnits="userSpaceOnUse"
                            patternTransform="rotate(45 50 50)">
                        <line stroke="#ffb29d" stroke-width="2" y2="10"/>
                    </pattern>
                </defs>
                <rect x="5" y="5"
                      width="40" height="100"
                      fill="url(#Occupied)"
                      stroke="#ff7094"
                      stroke-width="1" />
            </svg>
It would love to have an export feature for Diagram which will give the possibilty to make an export to Microsoft Visio.
Expand/Collapse feature on click of the diagram nodes.
Load data on demand during enpansion of the node.