Unplanned
Last Updated: 04 Sep 2023 14:57 by Danish

The Scatterline Chart is flipped upside down if the Height is under 100px.

Reproduction

1. Run this REPL
2. Set the height of the Chart to 90px
3. The chart is rendered upside down
Unplanned
Last Updated: 25 Aug 2023 10:21 by ADMIN
Created by: Danish
Comments: 1
Category: Charts
Type: Bug Report
0

Hi,


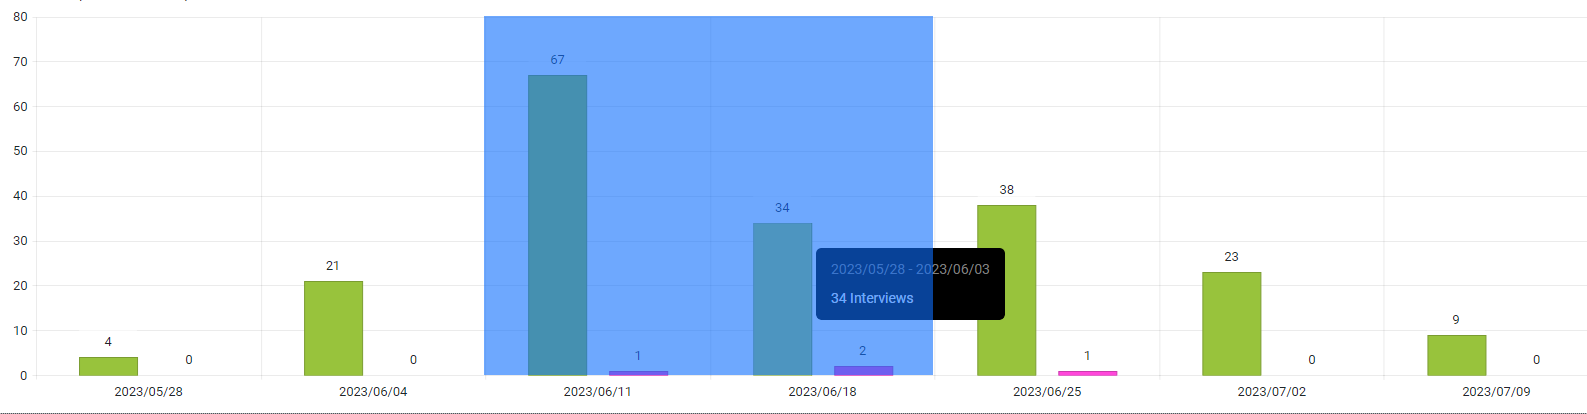
We are implementing chart control in our application and we noticed spikes in the chart when we are using time series that contains UTC timestamps with milliseconds that are divisible by 100. The issue is reproduceable on Telerik REPL as well and I am attaching the REPL link as well


Telerik REPL - Chart


I was wondering if you guys can provide some insight from your end as to whether that is indeed a bug and some work arounds and timeline on when we can resolution from your end.


Cheers,


Danish Shahid

Unplanned
Last Updated: 13 Jul 2023 10:59 by Ilan
So the one thing that is missing for me from the zoom functionality is an event that tells me the selected values

i.e here I would like it to return: 2023/06/11 & 2023/06/18 
Unplanned
Last Updated: 26 Jun 2023 08:24 by MJ
Created by: MJ
Comments: 0
Category: Charts
Type: Feature Request
1

I want to be able to set different colors for the separate series items.

===

ADMIN EDIT

===

A possible option for the time being is to add each item in a dedicated series where you can specify its color.
Unplanned
Last Updated: 08 Jun 2023 13:42 by Rishi

Currently, the Chart does not plot anything when zero values are included in the dataset on a logarithmic axis.

Reproduction: https://blazorrepl.telerik.com/cdYgkWFH23W9PVon54

At least the "Success" data should be plotted.

Unplanned
Last Updated: 23 May 2023 15:35 by jordan

I am trying to programmatically update the Chart data during runtime to display live data. The Chart does not seem to refresh and show this change in the viewport.

I've tried:

  • using an Observable Collection;
  • creating a new collection instance and reassigning the Data parameter;
  • calling the Refresh method;

The result is the same - the Chart does not react to the data change. This applies to other component parameters as well.

===

ADMIN EDIT

===

A possible workaround for the time being is forcing the Chart to re-render. To do so, you may wrap the Chart in a custom component and call StateHasChanged() in this component when the data is updated.

Here is a runnable sample: https://blazorrepl.telerik.com/wxEzwxbJ24WDjnMp11.
Unplanned
Last Updated: 15 Mar 2023 13:27 by Chris
Created by: Chris
Comments: 0
Category: Charts
Type: Feature Request
1
Support for ObservableCollection - allow the Chart component to use ObservableCollection data.
Unplanned
Last Updated: 09 Mar 2023 15:24 by Matt
Created by: Matt
Comments: 0
Category: Charts
Type: Feature Request
2
I would like to get an event that fires when the user click in the plot area of the Chart. 
Unplanned
Last Updated: 06 Mar 2023 14:07 by Werdna
Created by: Werdna
Comments: 0
Category: Charts
Type: Feature Request
3

Please see the links below to see examples of the scale break feature I'm looking for: Scale Breaks - ChartView - Telerik UI for WinForms.

https://docs.telerik.com/devtools/aspnet-ajax/controls/chart/features/scale-breaks

I know about Logarithmic Axis as well, but it's not exactly what I'm looking for.

Unplanned
Last Updated: 21 Feb 2023 07:15 by Ilan
Created by: Ilan
Comments: 0
Category: Charts
Type: Feature Request
2
I want to be able to specify and configure ErrorBars for the series like in Kendo UI for jQuery.
Unplanned
Last Updated: 13 Feb 2023 12:27 by Heiko
Created by: Heiko
Comments: 0
Category: Charts
Type: Feature Request
1
I would like to get an event that fires when the chart renders. 
Unplanned
Last Updated: 13 Feb 2023 12:26 by Heiko
Created by: Heiko
Comments: 0
Category: Charts
Type: Feature Request
1
I would like to be able to set default global options per series type with the SeriesDefault configuration. 
Unplanned
Last Updated: 22 Dec 2022 14:26 by Tanner
Created by: Tanner
Comments: 0
Category: Charts
Type: Feature Request
2
I want to be able to set a border-radius to the plot area to round the edges. 
Unplanned
Last Updated: 22 Nov 2022 12:13 by ADMIN
Created by: Jesper
Comments: 4
Category: Charts
Type: Feature Request
12
I would like to customize the appearance of the Chart Legend
Unplanned
Last Updated: 04 Nov 2022 17:29 by ADMIN
Created by: Christopher
Comments: 2
Category: Charts
Type: Feature Request
8
This is a feature request....please add box and whisker plot & sankey charts to your blazor and/or asp.net core chart controls.
Unplanned
Last Updated: 04 Nov 2022 17:25 by Christopher
Created by: Christopher
Comments: 0
Category: Charts
Type: Feature Request
3
Please add Funnel chart type such as the one available in Kendo.
Unplanned
Last Updated: 27 Mar 2022 09:05 by Andrew

---

ADMIN EDIT

Screen recording attached below, code to reproduce  it too.

---

Unplanned
Last Updated: 10 Feb 2022 17:38 by ADMIN

Is it possible to change plot area background color on charts so that every second line is a different color.

I have attached a image with the background color look.

---

ADMIN EDIT

The current request targets the ability to color the whole plot area in alternating way. If you need to only color a certain range of the plot area, you may take a look at the Plot bands feature request.

While the most common use case is to alter the background color based on the major plot area units, we'd like to gather your feedback on how you'd expect the feature to behave - allow color altering on major units, minor units or custom steps.

---

Unplanned
Last Updated: 07 Jan 2022 21:18 by Edward
Created by: Emil
Comments: 1
Category: Charts
Type: Feature Request
5
I would like to control the font of the value axis labels.
Unplanned
Last Updated: 03 Jan 2022 14:55 by ADMIN
Created by: Andrew
Comments: 1
Category: Charts
Type: Feature Request
1
The current version of the tooltip template context contains the information for the series color, but a particular data point might have a different color. Exposing such an option will allow better customization of the tooltip.