Unplanned
Last Updated: 20 Oct 2023 11:10 by Mark
Created by: Bryon
Comments: 2
Category: Charts
Type: Feature Request
9
I want to align my bar chart labels to the left of the chart.
Unplanned
Last Updated: 12 Sep 2023 15:17 by ADMIN
Created by: Bryon
Comments: 5
Category: Charts
Type: Feature Request
14

It would be nice to make the label container less than the width of the element so that it stands out more.

I know that it can be set to different colors and transparent but adjusting the width would be a nice addition as well.

Unplanned
Last Updated: 31 Jan 2024 12:11 by ADMIN
Created by: wu
Comments: 3
Category: Charts
Type: Feature Request
8
Completed
Last Updated: 02 Dec 2021 14:51 by ADMIN
Release 2.30.0
Created by: Kelly
Comments: 7
Category: Charts
Type: Feature Request
24
At the moment it is always white. I often want it transparent so it can blend better with the rest of the content (e.g., it should be able to the color of the grid row it is embedded in).
Completed
Last Updated: 05 Aug 2020 07:48 by ADMIN
Release 2.16.0
Created by: Louis
Comments: 1
Category: Charts
Type: Feature Request
3

Hi!

I'm more than a little impressed with your Blazor efforts to-date, but there's one component lacking: a CandleStick chart.

Completed
Last Updated: 22 May 2024 13:24 by ADMIN
Created by: Sylvain
Comments: 10
Category: Charts
Type: Feature Request
59

Hi,

I would like to be able to show / hide a serie by clicking to a legend.

Is there a way to do it actually ?

Unplanned
Last Updated: 24 Oct 2023 14:55 by ADMIN
Created by: Sylvain
Comments: 4
Category: Charts
Type: Feature Request
14

I would like to visually distinguish a certain element in a series from the others if its value matches a given criteria (for example, value exceeds a threshold). Ideally, I'd want to add a hash to my bars, because I want to keep all items with the same color (I don't want to use the ColorField).

Something similar is available in Kendo: https://demos.telerik.com/kendo-ui/bar-charts/visuals.

Unplanned
Last Updated: 11 Nov 2019 13:28 by ADMIN
Created by: Bill Wolff
Comments: 4
Category: Charts
Type: Feature Request
9
Trying to upgrade an Angular app that uses WijMo charts. It graphs server and web performance data. I can easily make a line or scatter chart but your Blazor component is not very flexible using DateTime on the x axis. I got it to work on a Line but not a ScatterLine. Also, when using the Line with AxisType = Date, I can't get the  BaseUnitStep working. Is there an enumerator for that? It tries to write the x label for every hour over 10 days. 
Completed
Last Updated: 11 Oct 2019 08:01 by ADMIN
Created by: James
Comments: 1
Category: Charts
Type: Feature Request
0
Hi there, it would be really nice if there were styling options available for the charts. I know that they styling gets inherited from the Telerik theme, but on the theme builder we can't get what we need without disrupting other UI styles. 

What we are looking for is really just a means to change the legend text color, and other text colors, as well as being able to set a background. 

For instance: 


Through the Telerik theme we would not be able to do this, maybe on one chart, but not different styles for each of the 3 charts. 

Possibly also having the chart to resize as the browser resizes, with an included Delay of 20ms. Just a thought. 
Completed
Last Updated: 04 Jul 2023 13:38 by ADMIN
Release 4.4.0 (07/19/2023) (R3 PI1)
Created by: Datafyer
Comments: 3
Category: Charts
Type: Feature Request
11

It would be helpful to me if this chart type was supported.

https://demos.telerik.com/kendo-ui/range-bar-charts/index

Unplanned
Last Updated: 27 Sep 2019 06:41 by ADMIN
Created by: Datafyer
Comments: 0
Category: Charts
Type: Feature Request
12

I have a page where I am displaying a chart and associated data in a grid below.

Being able to range select in the chart like in the asp.net core link below would offer a much better user experience.
That way the selected range could be specifically targeted in the grid data below the chart.

https://demos.telerik.com/aspnet-core/chart-api/selection

Completed
Last Updated: 25 Sep 2019 08:37 by ADMIN
Release 2.1.0
Created by: Mark Stevens
Comments: 2
Category: Charts
Type: Feature Request
1
Do you have any timelines for adding additional chart types to bring your charting functionality in line with your other platforms (ASP.NET Core charts for instance) I'm using scatter/bubble and have to use competitors charts to reproduce this functionality.
Completed
Last Updated: 02 Jan 2023 15:03 by ADMIN
Release 2.0.0

If a chart is too narrow and x-axis labels overlap, the user can zoom out and refresh the charts to allow the labels to fit. This feature request is to allow the charts to reformat themselves as the zoom level is changed (without having to refresh the page). Steps to reproduce:

    • Make browser narrow (say half screen)
    • Change zoom to 500%
    • Go to https://demos.telerik.com/blazor-ui/chart/line-chart
    • See line chart is squished with overlapping x-axis labels
    • Zoom out to 100%
    • ­See line chart remains squished with overlapping x-axis labels even though there is a lot more room
    • Now refresh the page
    • See line chart is no longer squished with x-axis labels visible

Completed
Last Updated: 02 Feb 2022 21:01 by ADMIN
Release 3.1.0
Created by: Mark Stevens
Comments: 0
Category: Charts
Type: Feature Request
3
At the moment, the charts always have a flat look, but I want the rounded (gradient) look that you get when you don't reference the theme (see attached).
Unplanned
Last Updated: 09 Aug 2019 05:14 by ADMIN
Created by: Mark Stevens
Comments: 0
Category: Charts
Type: Feature Request
22
Completed
Last Updated: 10 Jun 2020 10:03 by ADMIN
Release 2.15.0
Created by: Bryon
Comments: 2
Category: Charts
Type: Feature Request
35

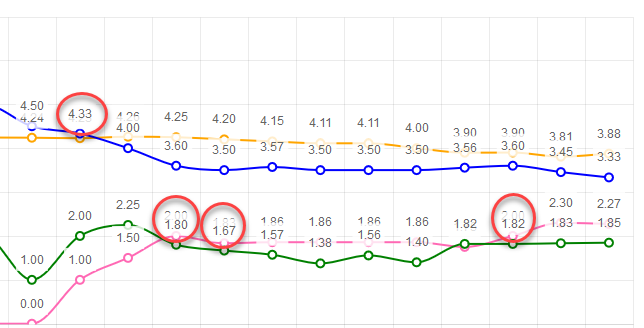
The idea is to ensure labels don't render on top of each other. If series values are close to each other, labels start overlapping. Having tooltips will let me remove the labels.

Example:

Completed
Last Updated: 28 Jan 2021 10:05 by ADMIN
Release 2.15.0
I'm using version 1.1 of the UI for Blazor and have leveraged several different types of charts.  I now need to add click events on different parts of the chart so I can navigate to a drilldown page.  How can I accomplish this?
Completed
Last Updated: 25 Sep 2019 08:36 by ADMIN
Release 2.1.0
Created by: Bill
Comments: 0
Category: Charts
Type: Feature Request
5
Please add the capability to provide XY scatter chart data plots into the Charts toolset.
1 2 3 4