While working on pivot grid, we observe that the filtering condition is applied. But there is no visual indicator showing that the current pivot has applied a filtering condition on a given column.
For instance, the following captured picture is obtained from the demo page. I selected Beverages in the "Category" filter and applied it to the pivot grid.
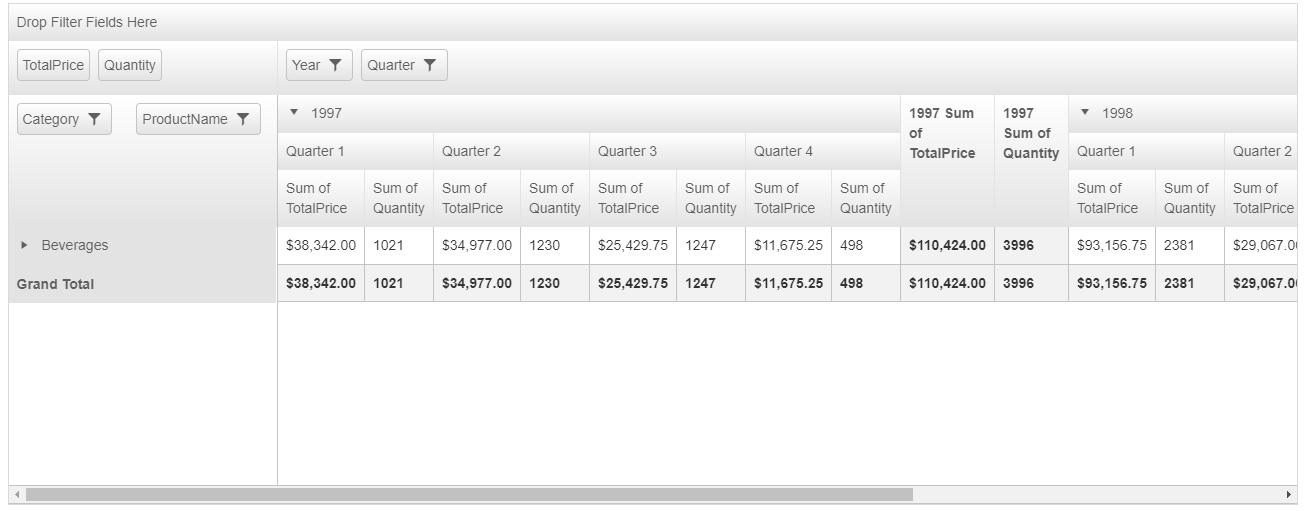
However, there is no visual clue to tell me how many filtering columns are been used at the moment.
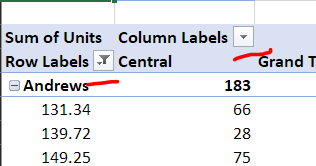
Here is how the filtered and non-filtered fields appear in MS Excel:
1) want to Set Column Resize for Pivot grid same like Rad Grid.

Is there any way to do Column resize at runtime same like Rad grid.
Customer wants the pivot grid column should be resized at runtime same like the RAD Grid.Which will be more easy and user friendly for the Customers.

2) Need Key board Navigation in Pivot grid same like Radgrid.
Customer want Keyboard Navigation for Pivot Grid same like rag Grid.its hard for the customers to use scrolling for every time to see the large no of columns .
Is there any way to do Key board Navigation for the Pivot grid.
One of my PivotGridColumnField's is a smalldatetime field from SQL Server.

In the PivotGrid column header labels I want the dates to be formatted as MMM-yy,  like Aug-15.

I can accomplish that for the detail columns (the non-aggregate columns) by setting the DataFormatString="{0:MMM-yy}"

But that format string is NOT applied to the label of the column total header.  The aggregate column header label still reads:  "08/01/2015 00:00:00 Total"

If you allow a custom format to the detail column headers, it would be logical to assume I want that same custom format used in the aggregate column header.  So in my example, that label should display:   Aug-15 Total

I was told in the Forum that I'd have to parse that column header string in the  CellDataBound Event to get the date portion and then format it and use that to set the header text.  That is a very UGLY solution.

I don't want to strip the word "Total" out of that string and then then convert the date that remains to a string in the date format I want.

Thanks,
Brent
Hi Team,

Using Persisting Pivot Settings : Filter Settings is being saved in filter window after clicking cancel button
(Ex : http://demos.telerik.com/aspnet-ajax/pivotgrid/examples/applicationscenarios/persisting-radpivotgrid-settings/defaultcs.aspx?product=persistenceframework)

1. Click on any filter icon in Pivot Grid (CategoryName filter icon)
2. Deselect first item from the list in pop up window (like Beverages)
3. Click Cancel
4. Filter is not applied on Pivot Grid which is perfect
5. Click on same filter icon (CategoryName filter icon)
6. Observe that it is still showing first item as not selected (though the filter was cancelled and is not present on grid as well)

Expected : When we click cancel on Filter Window, the changes done should be removed.
When adding a calculated column to give you something like the Avg Price. The column appears across the whole pivot grid. So say you have your totalprice and qty showing for different stores. So the grid groups by stores. When you add the grandtotal calculation you get a new column added to each store.

I don't want the avg price added to each store .. I only want to see the average price in the grand totals section to the right?

Thanks.
Currently, you have ColumnGroupsDefaultExpanded and RowGroupsDefaultExpanded available for the PivotGrid.

I would like to request an ExpandedGroupsBehavior that allows you to set a particular level to expand to.

To better explain this, the WPF PivotGrid has this. Here is a the documentation: http://docs.telerik.com/devtools/wpf/controls/radpivotgrid/features/expand-behavior.html

Thank you
It will be useful to have sorting feature in PivotGridAggregateField. For example as in attachment one may want to sort the grades of students as me :)
Looking forward to have sorting feature in new releases.
The RadGrid attachment shows the Data I need to present in the form of rows of Products each with a start date.
HOWEVER, I need to present the data "per start date" so basically the Date would be a Column Header, then each date would show the duration, start time, and price under each Start Date.
The PivotGrid attachment shows how I was able to take the same data and present it with the start date as a column but is not sufficient for my needs. I need to be able to Page by Start Date, so essentially a custom pager that keeps track of the Start Date and only shows like 3 days at a time. So in the screenshot you see Sept 9th through Sept 25, however I would like to have the pager control which rows are presented and then be able to page on the date column rather than showing the full month with a horizontal scrollbar.
The aggregates functions highlighted in the attached screenshots have common names that are used in the industry and as such they are not localized. This feature request is so that their names can be localized through global resx files along with other strings in the RadPivotGrid control.

In the meantime, you can use the ItemDataBound event to change cell texts based on your requirements. You can find similar examples here: https://demos.telerik.com/aspnet-ajax/pivotgrid/examples/appearance/conditionalformatting/defaultcs.aspx
For example, to change the Sum aggregate name in the column header, you can do this:
            else if (e.Cell is PivotGridColumnHeaderCell)
            {
                PivotGridColumnHeaderCell cell = e.Cell as PivotGridColumnHeaderCell;
                cell.Text = cell.Text.Replace("Sum ", "custom ");
Would be good if ajax pivotgrid filter window supported OLAP dimension hierarchies

The Filter window / popup, doesn't seem to respect an OLAP dimension hierarchy.  It just shows a flat list at top level (for example case of date hierarchy just shows year).

See attached for a date hierarchy example in three different cube browsers, each with the same OLAP SSAS backend. Browsers are a) ajax pivot grid, b) kendo pivot grid and c) excel

The Ajax version just shows flat list, whereas kendo pivot and excel show the hierarchy

Thanks

Chris
I have a scenario in my web application where I need possibility to sort values in RadPivotGrid by field existing in datasource, but is not displayed in RadPivotGrid.

For Example I have flats that should be sorted in order defined in field sort_order, I can add this field to RadPivotGrid, but I don't want to show it to user.
This approach works perfectly with standard RadGrid, but unfortunately does not work with RadPivotGrid. Flats are sorted by their names, with is wrong from my point of view.
Have a way to expand/collapse all within PivotGrid for each group level. It would be nice if the context menu (right click) would allow this.
Hi I have a straightforward feature request: I would like to be able to "get" the row/column "filter" values the user has selected server-side. Basically need a public property or some type of getter. Currently on the PivotGrid, the row/column "Filter" "Includes/Excludes" can be "set" programmatically, but user selected values can't be easily gotten.

I would use it in a couple ways:

1) to display context to the user for the numbers in the grid. (e.g., show the user the active filter values responsible for the numbers they are seeing in the PivotGrid Detail).

2) I need the filter values to close Ticket 1168787.

A Telerik employee make a nice sample project to do drill-through functionality: https://www.telerik.com/blogs/how-to-implement-drill-down-functionality-in-telerik-s-pivotgrid-for-asp.net-ajax-part-2

But the PivotGrid counts and RadGrid detail data records returned are not in agreement because selected PivotGrid filters aren't applied to the detail returned in the RadGrid. I need to do that. I need to be able to mimic a drill through action into the detail records that make up the data counts. If I click a cell that says "100" (orders, 2018 year included) I need 100 orders returned in the detail. Not 7000 orders (all order years, unfiltered).

In that ticket, I'm trying to mimic the functionality similar to an SSAS "drillthrough action" (like many cube browsers have built in, e.g., RANET OLAP), except here with a regular SQL data source. This way I can drill into the detail records that make up the numbers displayed to the user in the PivotGrid. However, as it stands, the counts and detail will not be congruent until I can get the filter values selected by the user and apply them accordingly to the data set for the detail RadGrid. The BI users expect to be able to drill into the data and I need to provide it.

Thank you,

Tom
Some of the most powerful features of the new RadPivotGrid are based around aggregates. It would be great if you could simply sort by any aggregate fields set up, including Grand Totals. I have not seen any documentation on doing this as it stands.