Allow easy exporting of a chart to a Xamarin.Forms image object. This will allow the images to be shared using social media.
When you have a Chart instance with fixed size and it's larger than the screen size, the Chart is not rendered and the following error is displayed in the VS output:
"RadExtendedCartesianChartView not displayed because it is too large to fit into a software layer (or drawing cache)"
Using the RadPieChart and PieSeries (UI for Xamarin v2019.2.802.1 from NuGet), I can currently set the LabelBinding (or LabelFormat or LabelFormatter) to adjust the strings displayed in the labels on the slices of the pie chart, but unlike other chart controls, I currently have no way to modify the styling of those labels like I can in every other chart control I've used from Telerik UI for Xamarin.
It seems to me that it would be best to have more properties on the PieSeries class, like LabelFontSize, LabelFontAttributes, LabelFontFamily, LabelTextColor, and LabelMargin (Label prefix to distinguish from LegendTitleBinding could be kept or discarded as desired on some of these names).
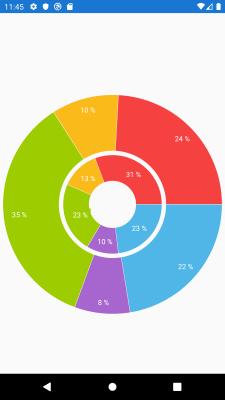
LabelMargin would be particularly helpful to eliminate the UWP situation wherein currently all pie slice labels overlap with the outer lighter ring of the pie chart (see image from UWP). The others just seem needed to maintain a consistent appearance of charts within an app - if all my chart labels are dark blue and a different font size and style except for the not-style-able black labels in pie charts, that makes pie charts hard to incorporate without looking bad or forcing styling elsewhere to match the pie charts' fixed values.
If you have the following PieChart with donut series definition:
<telerikChart:RadPieChart HeightRequest="200"
                          WidthRequest="200">
    <telerikChart:RadPieChart.Series>
        <telerikChart:DonutSeries ShowLabels="True"
                                  ValueBinding="Value"
                                  ItemsSource="{Binding Data}" />
        <telerikChart:DonutSeries ShowLabels="True"
                                  RadiusFactor="0.45"
                                  ValueBinding="Value"
                                  ItemsSource="{Binding Data1}" />
    </telerikChart:RadPieChart.Series>
</telerikChart:RadPieChart>
On android works as expected:
On iOS the series are overlapped and not visualized as expected. The radius factor is not respected
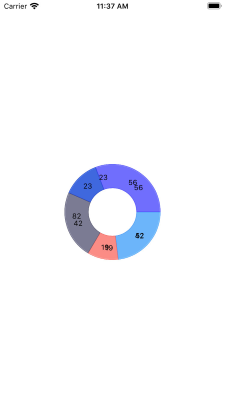
On UWP the second donut series in not visualized and the radius factor is not respected.
After setting the MajorLinesVisibility property to GridLineVisibility.Xy only the Y lines are showing up.
If the series is added after the page constructor, the vertical axis labels are not shown.

As a workaround, create the series in the constructor and set its ItemsSource at a later stage.
As of the latest release (10/04/2019) RadPieChart with a PieSeries having LabelBinding set to a property name, and ShowLabels set to True, with the list of data bound to ItemsSource containing one or more empty pie slices (a null in the list), causes a System.Reflection.TargetException to be thrown on load of the page containing the chart in iOS (this scenario works fine in UWP).
I am using the latest available Visual Studio 2019 (16.3.5) and the latest available Xamarin.Forms package (4.2.0.848062) and testing on an iPad with iOS 13.1. The reason I need to have a null value in the list is so that the custom color palette I'm applying will always apply the same colors to the same data points (pie slices), even though in some cases, zero or one or two of the three pie slices will have no data value (and so should not appear in the chart, but still "use up" the corresponding color in the 3 colors of the palette).
In the 08/02/2019 release, this scenario worked fine in iOS (the 09/13/2019 release had the https://feedback.telerik.com/xamarin/1431067-chart-ios-invalidcastexception-is-thrown-when-the-chart-is-loaded issue, which is now resolved in the 10/04/2019 release, but which prevented my testing in iOS since in my app I had RadCartesianCharts on the same pages as the RadPieCharts).
The newly broken functionality in iOS could possibly be related to two other items that are marked completed:
https://feedback.telerik.com/xamarin/1366403-piechart-tooltip-behavior-is-not-working-properly (in 10/04/2019 release)
https://feedback.telerik.com/xamarin/1365842-chart-null-value-support (in R3 2018 SP release)
When the Chart is zoomed, new labels are not rendered on iOS.