Allow to track points that intercept vertical line from mouse position (as now)  or points that intercept horizontal line from mouse position.
So allow to choose TrackDirection = Horizontal/Vertical

Thanks.
marc.
Currently, RadChartView doesn't support the ChartToolTipBehavior for series that are using BitmapRenderOptions, Direct2DRenderOptions, or SkiaRenderOptions. The tooltip doesn't display.
Currently the MouseWheel event used to zoom is not handled which means that the event will bubble to the parent elements which can lead to scrolling issues. Add an option to handle the MouseWheel event when the chart zooming is enabled.
To get the desired result, you can handle the MouseWheel event of the chart manually.
 private void RadCartesianChart_MouseWheel(object sender, MouseWheelEventArgs e)
 {
     e.Handled = true;
 }
In some cases the CartesianGridLineAnnotation can be offset with a single pixel from the expected position on the axis. For example, if the annotation is positioned at value 0 and there is a tick, a offset between the tick and the annotation can be observed.
To work this around, you can manually offset the annotation by setting its Top Margin.
<telerik:CartesianGridLineAnnotation Margin="0 1 0 0"/>
Create 2-dimensional contour plot from unstructured 3-dimensional data.  Means the points are randomly arranged in the XY plane.

Attached file shows an example of what I would like to achieve.  I think the contour plot Telerik does currently requires a structured grid, i.e. full grid of NxM points.
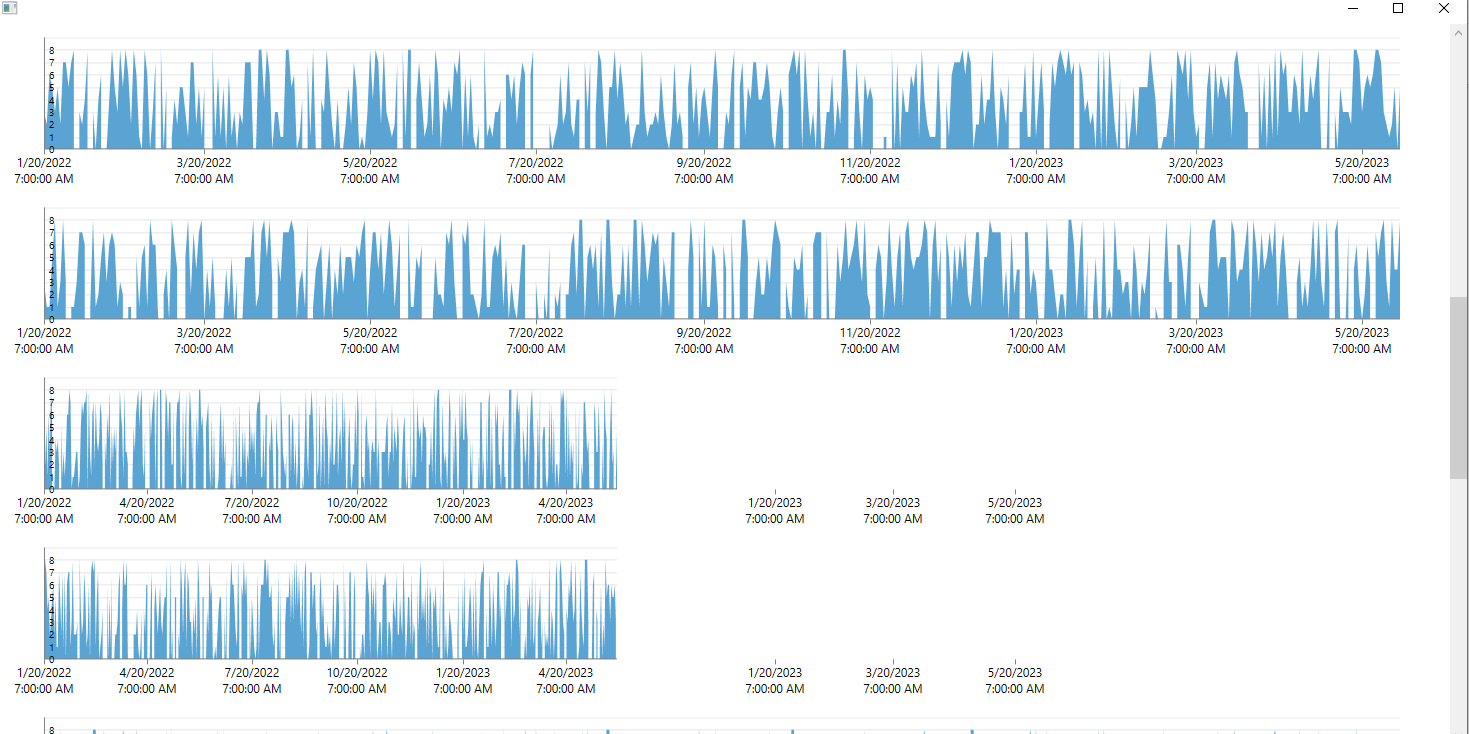
The problem arises when we have many graphs on one window and when we scroll to the bottom then to the middle of the window and then resize the width of the window, not all graphics dynamically resize, some harden to the previous size.
I am attaching a project in which you can reproduce the problem.
And I am attaching a video where the problem is clearly demonstrated.
Please solve the problem as soon as possible for our product it is critical!