Unplanned
Last Updated: 29 May 2024 14:10 by Martin Ivanov
The TickOrigin setting of the LinearAxis doesn't work when the MinorTicksPerMajor property is set to a value bigger than 0.
Unplanned
Last Updated: 20 May 2024 15:30 by Stenly
Created by: Stenly
Comments: 0
Category: ChartView
Type: Feature Request
0
Add hieken ashi candlesticks series to the available series of the RadChartView control.
Unplanned
Last Updated: 07 Mar 2024 16:26 by Martin Ivanov
Currently, the categories in the CategoricalAxis are ordered by the order of their appearance in the plotted data. Allow ordering the categories manually.
Unplanned
Last Updated: 04 Mar 2024 07:54 by Martin Ivanov
Add an API in the chart spline series (like a method override or similar) that allows you to calculate your own set of additional points that render the spline in the chart's spline series.
Unplanned
Last Updated: 16 Nov 2023 15:17 by Martin Ivanov
By default when the chart is zoomed in, the major step between the axis ticks is automatically re-calculated to match the new zoom level. Add a property that allows you to access the recalculated major step.
Unplanned
Last Updated: 14 Sep 2023 07:56 by Martin Ivanov

In some cases the CartesianGridLineAnnotation can be offset with a single pixel from the expected position on the axis. For example, if the annotation is positioned at value 0 and there is a tick, a offset between the tick and the annotation can be observed.

To work this around, you can manually offset the annotation by setting its Top Margin.

<telerik:CartesianGridLineAnnotation Margin="0 1 0 0"/>

Unplanned
Last Updated: 20 Jun 2023 14:31 by ADMIN
Created by: Martin Ivanov
Comments: 2
Category: ChartView
Type: Feature Request
1
Implement pan and zoom ability for the polar chart.
Unplanned
Last Updated: 16 Nov 2022 13:48 by Ashraf
The series are not rendered as expected when using Direct2DRenderOptions and hiding labels (by setting the LabelInterval, SmartLabelsMode or via a different approach)
Unplanned
Last Updated: 12 Oct 2022 06:40 by Martin Ivanov
Created by: Martin Ivanov
Comments: 0
Category: ChartView
Type: Feature Request
1
Add ScatterRangeSplineSeries visualization, same as RangeSplineSeries, but in scatter scenario (two linear axes).
Unplanned
Last Updated: 29 Jul 2022 08:11 by ADMIN
Created by: Nazar
Comments: 4
Category: ChartView
Type: Bug Report
1

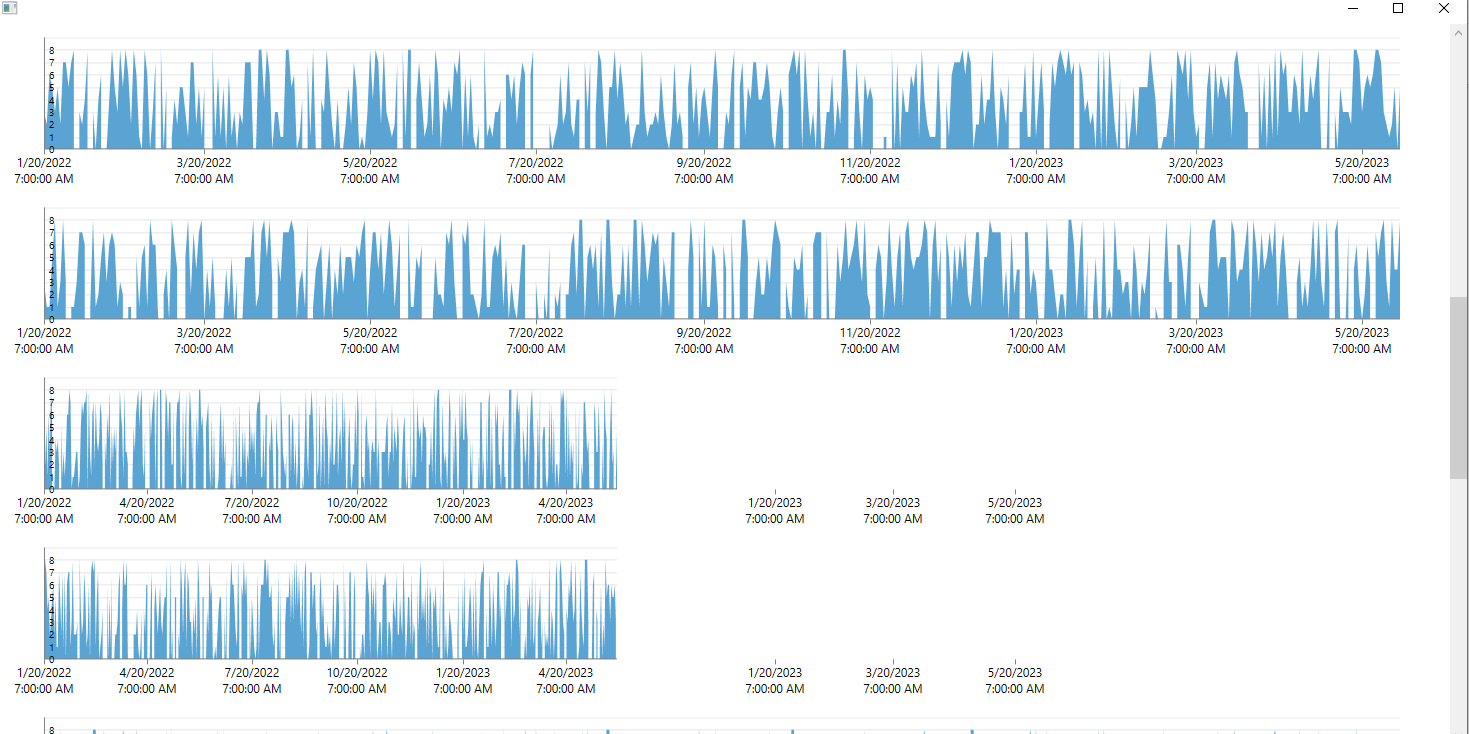
The problem arises when we have many graphs on one window and when we scroll to the bottom then to the middle of the window and then resize the width of the window, not all graphics dynamically resize, some harden to the previous size.

I am attaching a project in which you can reproduce the problem.

And I am attaching a video where the problem is clearly demonstrated.

Please solve the problem as soon as possible for our product it is critical!

Unplanned
Last Updated: 17 May 2022 09:12 by Martin Ivanov
Add mechanism in RadCartesianChart to change the axis origin position. Currently, you can position it only top, left, right or bottom. Add an option to position the axis at an arbitrary position on the opposite axis. For example, to position the horizontal axis in the middle of the vertical axis or at value lets say 3.
Unplanned
Last Updated: 17 Dec 2021 09:39 by ADMIN
Created by: Martin Ivanov
Comments: 0
Category: ChartView
Type: Feature Request
1
Currently, the chart provides a selection feature where you can select data points by clicking on their visual elements (ellipses, bars, etc.) or setting the IsSelected property. Add a feature that allows you to select the entire series. This feature is meaningful when using line or area series and you want to highlight (select) the clicked series.

You can easily implement it by subscribing to the MouseLeftButtonDown event of the chart series and change the series' Stroke or Fill property.
Unplanned
Last Updated: 08 Oct 2021 08:49 by ADMIN
The RadCartesianChart's series allows you to provide a collection of primitive types (like List<int>) to its ItemsSource which will render a proper chart, as shown in the Create Data-Bound Chart article. 

Currently, this is not supported if you use the sampling feature of the chart (ChartDataSource). ChartDataSource can't work with collections with primitive types. Add support for this.
Unplanned
Last Updated: 18 Oct 2021 12:35 by Guido
Created by: Guido
Comments: 3
Category: ChartView
Type: Bug Report
1

When a chart have long labels on the X axis (like date and time) the zoom is not accurate on the horizontal extents with both mouse wheel and drag area.

The reason is probably that the screen coordinates of the selected area are not mapped correctly on the X axis. The mapping works fine for tooltip.


You can verify this behavior in the attached Solution. In the images you can see the selected area (01), that the zoomed area is a region with no points (02) and the actual position of the points.


Unplanned
Last Updated: 01 Jun 2021 10:50 by ADMIN
Created by: Martin Ivanov
Comments: 0
Category: ChartView
Type: Feature Request
1
The chart series allow empty values, which means that if a data point has a null or NaN value there won't be a visual element drawn on the chart. The financial indicator (a type of chart series) support this, but because of their nature, if an ItemsSource is provided, the null values are threaded as zeroes (the number 0) during the automatic generation of data points. This is because, the data point values are calculated based on a function which includes a combination of the previous data item values. 

Add a mechanism like a method override or a property that can alter this behavior. In this case, if the data item of the generated data point contains a null value, the visual element should be dropped (missing) as in the standard chart series.
Unplanned
Last Updated: 24 Mar 2021 14:47 by Brandon
Convert ZIndex property of the series to dependency property
Unplanned
Last Updated: 03 Dec 2020 12:09 by ADMIN
Created by: Dinko
Comments: 0
Category: ChartView
Type: Feature Request
1
More information regarding this functionality can be found in the Smart Labels help article.
Unplanned
Last Updated: 29 Oct 2020 15:46 by ADMIN
Currently, you can customize the fill and stroke of the data point visuals using the DefaultVisualStyle property of the series. In the common scenario, you can use data bindings to data bind the fill and stroke of the corresponding element. Additionally, you can use the DefaultVisualStyleSelector for such customization. However, when the Direct2DRenderOptions or BitmapRenderOptions are used, data bindings and the DefaultVisualStyleSelector are not support. The bindings in the DefaultVisualStyle throw errors and the selector is not applied.

Add support for conditional styling. This should include support for data binding in the fill and stroke properties of the element from the DefaultVisualStyle, or support for DefaultVisualStyleSelector, or another type of API. 
Unplanned
Last Updated: 22 Oct 2020 07:48 by ADMIN
Created by: Dinko
Comments: 0
Category: ChartView
Type: Feature Request
3

Add support for Tornado Chart. You can check this link for more information.

Sample Tornado Chart:


Unplanned
Last Updated: 26 May 2020 06:58 by ADMIN
Created by: Martin Ivanov
Comments: 0
Category: ChartView
Type: Feature Request
1
Allow setting OriginValue on the series in the RadPolarChart. Currently, the area series are fixed to OriginValue of 0.

The same feature is available in the RadCartesianChart series.
https://docs.telerik.com/devtools/wpf/controls/radchartview/features/originvalue
1 2 3 4 5