
I am using this to color the xaxis, but I notice, it changes the color of all items, so what I want is to color them individually based in a condition like this:
XAxis.Style.Color = IIf(ToolStatus=1,'Green','Red')
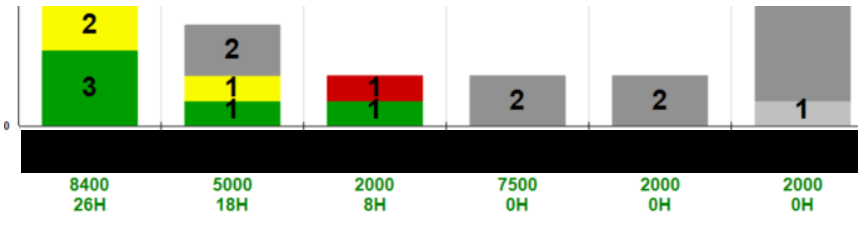
The problem all the text is in green not considering the condition individually by column.