

If the Telerik.ReportViewer.WinForms.ReportViewer.ReportSource property of the WinForms Report Viewer is null, besides displaying a message that no report has been loaded, the parameters area is also visible.
The parameters area shouldn't be visible when no report is selected, only the message should be displayed in the viewer's viewport.
I often need to have the same Report Parameters in different reports, including the main and its subreport. Currently, I need to add the parameters manually.
It would be very useful if we could copy/paste Report Parameters between reports.
Currently, logarithmic axes do not support the LabelStep and MajorStep properties, which makes it difficult to control label density and avoid visual clutter for larger data ranges.
Adding support for these settings (similar to numerical scales), or providing a way to conditionally hide axis labels, would significantly improve readability and axis customization.

I have a custom assembly with default 'version', 'culture', and 'publicKeyToken'.
When I reference the assembly in the 'assemblyReferences' element only with its 'name', the Reporting Engine recognizes it.
If I reference it with the full version, '1.0.0.0', it also works.
However, when I set the 'version' to '1.0.0', the Reporting Engine throws, stating that the assembly is not trusted and must be referenced in the 'assemblyReferences' element.

greetings
Summary
When the Web Report Designer is initialized with non-English string resources (via window.telerikWebDesignerResources), the authentication type selector in the Web Service Data Source wizard behaves incorrectly. Even though "Sin autenticación" (the translated value of WebServiceDataSourceNoAuthentication) is visually selected in the dropdown, the wizard behaves as if a different authentication type is selected — displaying additional required credential fields and blocking progression.
The issue does not occur when using English string resources (WebServiceDataSourceNoAuthentication = "No authentication").
---
Steps to Reproduce
1. Configure a Blazor Web Report Designer with Spanish (es-CO) custom string resources using window.telerikWebDesignerResources:
// WebReportDesignerStrings.es-CO.js
export class WebReportDesignerStringsBase {
constructor() {
// ...
this.WebServiceDataSourceNoAuthentication = "Sin autenticación";
// ...
}
}
// Load resources before designer renders
window.telerikWebDesignerResources = new WebReportDesignerStringsBase();
2. Open the Web Report Designer in the browser with the Spanish resources active.
3. Add a new Web Service Data Source.
4. In the wizard URL step, observe the authentication selector — it shows "Sin autenticación" as the selected option.
5. Attempt to proceed through the wizard.
---
Expected Behavior
With "Sin autenticación" selected (equivalent to "No authentication"), the wizard should:
- Require only the Service URL field
- Not display credential input panels
- Allow proceeding to the next step without authentication configuration
---
Actual Behavior
Despite "Sin autenticación" being visually selected, the wizard behaves as if a different authentication type (Basic or 2-step) is selected:
- Additional authentication configuration panels appear or are required
- The wizard blocks progression expecting credential inputs
- The behavior is identical to what occurs when "Basic" or "2-step" is selected
---
Root Cause Analysis
The designer's compiled JavaScript (webReportDesigner) appears to compare the selected authentication type against the English string "No authentication" internally, rather than against a stable enum or index value. When the display text is "Sin autenticación", this comparison fails and the wizard falls through to a non-"no auth" code path.
Evidence: applying the temporary workaround of keeping WebServiceDataSourceNoAuthentication = "No authentication" (English text) in the es-CO resources file resolves the issue completely — the wizard functions correctly while all other strings remain in Spanish.
---
Workaround
In the non-English string resources file, keep WebServiceDataSourceNoAuthentication in English:
// workaround: keep English value until Telerik fixes internal comparison
this.WebServiceDataSourceNoAuthentication = "No authentication";
---
Minimal Reproduction
@* ReportEditor.razor *@
@page "/reportEditor"
@using Telerik.WebReportDesigner.Blazor
<WebReportDesigner DesignerId="wrd1"
ServiceUrl="apiReport/reportdesigner" />
// Loaded before designer renders via IJSRuntime.InvokeVoidAsync
window.telerikWebDesignerResources = {
WebServiceDataSourceNoAuthentication: "Sin autenticación",
// ... other keys
};
---
Additional Notes
- Both es-CO and en-US string resource files contain 971 keys each — the issue is not caused by missing keys.
- The designer correctly picks up the localized strings for all other UI elements; the bug is isolated to the authentication dropdown value comparison logic.
- Confirmed on version 19.1.25.521; not tested on earlier versions.
thank for your attention.
have a nice day.

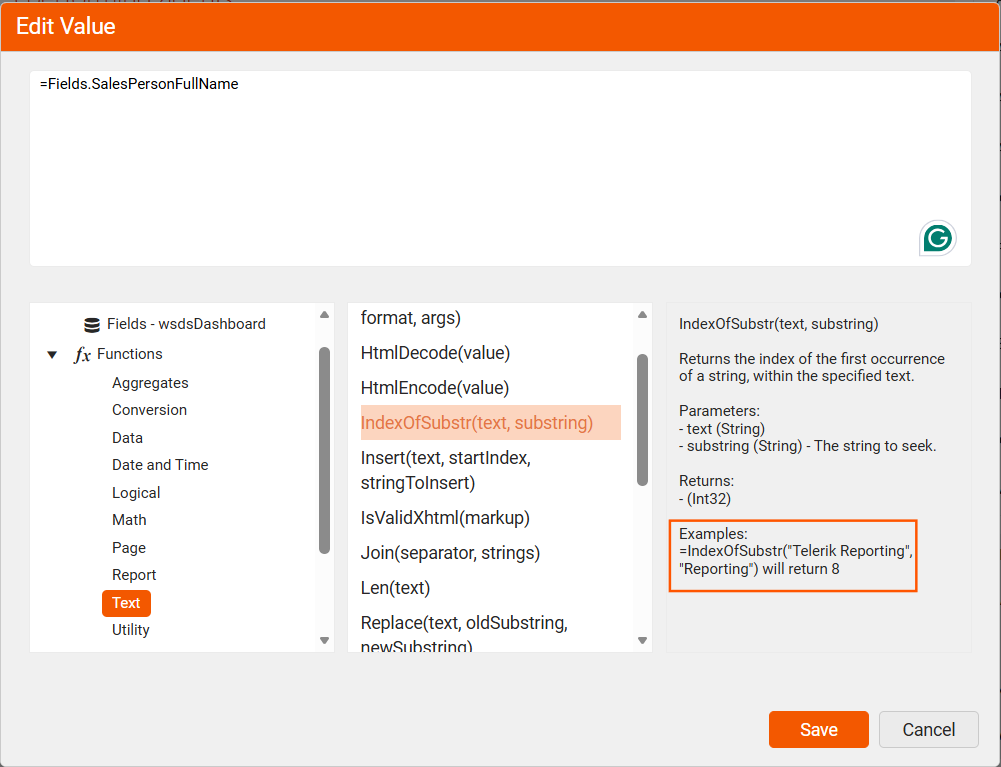
If I open the expression dialog in the Web Report Designer and select one of the available functions, I will see a sample snippet in the third column below the expression area.
This column is not selectable, so I cannot copy the example and test it out. This example should be copyable, so that each function can be easily tested in the report designer.
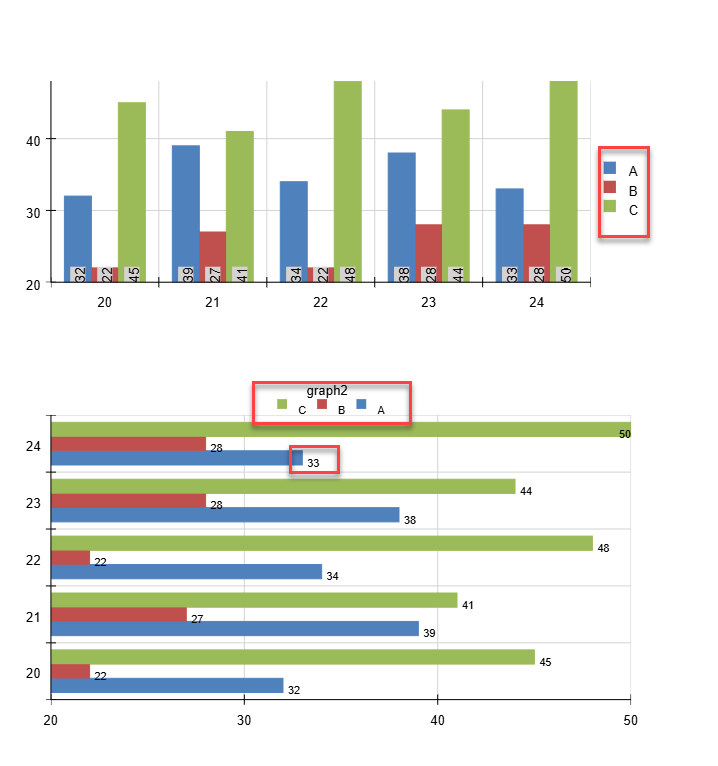
I have graphs in my report. I render them with Skia on Linux. The issue reproduces with Skia on Windows as well.
The legend labels are not aligned well with the color icon, and data labels on a horizontal bar chart (with OutsideEnd) are misaligned as well:
When the reports are displayed within the WPF Report Viewer, they are rendered in the XAML format, and it does not natively support SVGs.
Currently, the SVGs are always rasterized before being written to the XAML, which results in the images being blurred when zooming in the report viewer.
I am using the Standalone Report Designer for .NET to open a code-based report from an application that was migrated from .NET Framework. Before the migration, function calls defined in the designer.cs file were preserved and evaluated at runtime as expected. However, after migrating to the code-based reports functionality supported by the Standalone Report Designer for .NET, these function calls are evaluated immediately during the report import process, and the resulting values are then serialized and stored in the report definition.
It would be nice if the function calls were preserved in the imported report, allowing them to be evaluated later at runtime, as their return values may change depending on the execution context.
Hi, While the Report Designer exports tags to the PDF (with Accessibility enabled), the tags exported are not fully compliant with PDF/UA or 508 requirements. For example, my document has several hundred pages, each with two or three data tables on them. While the tags get exported, they are only Paragraph tags, and NOT Table tags. Is there a way to designate Table Header Rows, Header Columns, and Data Cells in Telerik Reporting such that upon export to PDF they get tagged properly?

Currently, the Download Raw Data action is available in the Windows Form Report Viewer. It is hard-coded there, and the download button appears when you hover over the data item.
The developer can cancel the action through the interactive action event handlers. However, the button persists even when the action is cancelled and doesn't do anything, which is misleading and confusing for the report readers.
Please let the developers disable the action/button, for example, through configuration in the viewer.
We get an incorrect “Email format is not valid” validation when sending a report to multiple recipients. We are using the wrapper/HTML5 Angular Report Viewer
Steps to Reproduce
- Open any report in the Telerik Report Viewer.
- Click Send Email.
In the To field, enter multiple valid email addresses, for example:
user1@example.com,user2@example.comor
user1@example.com;user2@example.com- Click Send.
Actual Result
- The validation message "Email format is not valid." is displayed beneath the To field.
- Despite the validation error, the email is sent successfully to all recipients.
Expected Result
- Multiple valid email addresses should be accepted without displaying a validation error.
- Since the email is successfully delivered, no validation message should be shown.

I use the exportBegin event to prevent the default export logic. However, when I do that, the default viewer notification remains, and I have to hide it manually:
                    exportBegin: function (e, args) {
                        args.handled = true; // Set to true to cancel the default export behavior.
                        //...
                        $(".trv-notification").addClass("k-hidden");
                    },

When a report is saved in the Web Report Designer, a popup appears confirming that the report was successfully saved. However, it is visible for far too long and blocks users during this time.
This feature request is to add an 'ok', 'hide' or 'close' button to these types of popups so the user can dismiss it.
Thank you,
Shannon
Hi there,
Adding an external style sheet to a report in a report-book triggers an error when previewing the report book, "Object reference not set to an instance of an object"
I've attached the bare minimum project to reproduce the error.
I've also tried upgrading to R3 2020
Cheers