I want to set the Table ColumnWidth to a particular value in the Properties of the Web Report Designer. There is no property ColumnWidth as in the Desktop designers, and I tried to set the Size.Width, which is available.
When I increased the Width from the Properties, in design time, there is no change in the column width, only dashed borders indicating the new size when selecting the corresponding TextBoxes. In runtime, though, the new size is respected.
The inconsistency repeats even when I open the saved report in another browser or through another application, hence this is not a caching issue.
My application uses RadDocking. When the WPF Report Viewer is hosted in RadDocking, some Graph labels appear cut.
The problem is related to the property UseLayoutRounding="True" in the RadDocking.
The workaround is to use the following setting:
RadPane pane = new RadDocumentPane();
pane.UseLayoutRounding = false;
pane.Header = "Report";
pane.Content = reportViewer;
DocumentPaneGroup.AddItem(pane, Telerik.Windows.Controls.Docking.DockPosition.Center);
However, in my report, the Interactivity options do not show any property for Level. I am only seeing basic properties like Action, BookmarkId, DocumentMapText, TocText, etc.
The Level field is completely missing.
When my application is hosted on Windows, Arabic date values appear reversed in the day part during PDF export with the Skia graphics engine. For example, 2025/01/01 is displayed as /01/10 when Arabic digits are used.
With the GDI graphics engine, the Date values are rendered as expected.
Hello Team Support,
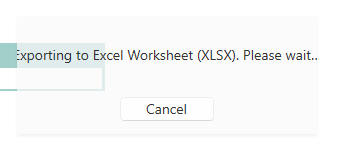
I work with the ReportViewer in WPF. I modified the description of some format in my App.config.
When I export my report, if the description is too long, it does not fit the message window anymore.
Here is a screenshot of my issue:
Thank you in advance.
Best regards,
Jonas
As soon as I reference a .NET 10 assembly containing models, there is a null reference exception that does not appear in EventViewer or Fusion logging at the opening of the Standalone Report Designer for .NET.
Here is a link to a muted video demonstrating how adding assembly references using the UI successfully adds the custom assembly to the designer, as well as the bug when removing the assembly version.
I have a crosstab with a dynamic number of columns (time periods) that can exceed 15-20 columns. When exporting the report to PDF in A4 landscape format, excess columns are truncated and never printed on additional horizontal pages.
The issue is related to the Crosstab property 'RowHeadersPrintOnEveryPage'. When set to True, it places additional row headers on each page when using physical pagination. I suspect these additional headers are not taken into account when calculating the necessary page area, hence the final part of the Crosstab is skipped.
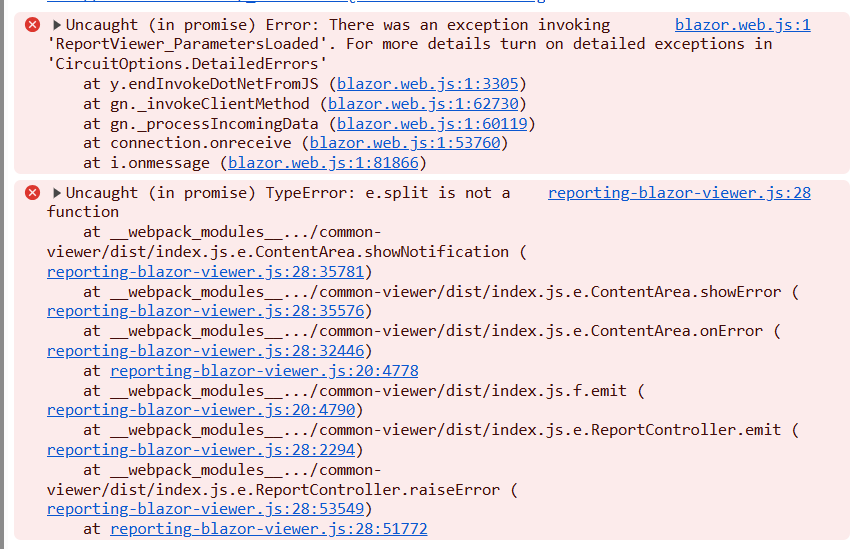
We see a console error when navigating away from the Blazor Native report viewer page. The page that contains the breadcrumb and the viewer has query-supplied parameters.
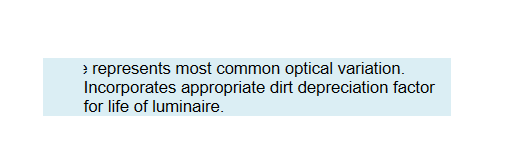
Using the text-indent CSS setting results in part of the text on the first line being cut off:
I am using the obsolete `Telerik.Reporting.Chart` type for a chart in a report. When I attempt to preview the report, an error is thrown:
The type "Telerik.Reporting.Chart" contained in assembly "Telerik.Reporting, Version=19.2.25.1001, Culture=neutral, PublicKeyToken=a9d7983dfcc261be" cannot be loaded.
To help improve the application's security, the reporting engine prevents loading types that are not essentially needed or listed as trusted by the user. If you consider particular types or assemblies as trusted include them in the corresponding TypeReferences or AssemblyReferences element of the 'Telerik.Reporting' configuration section in the application's configuration file.
When using the Native Blazor report viewer with the latest version of Telerik UI for Blazor (12.0.0), the following exception is thrown:
Unhandled exception rendering component: Object of type 'Telerik.Blazor.Components.TelerikToolBar' does not have a property matching the name 'Adaptive'.
We have some issues with cut off texts on our PDF reports. It only happens rarely and only with some fonts.
TSE note: This is an investigation item for tracking purposes. The actual font is included in the private GitHub issue linked to this item.
Currently, there is an MCP server that allows for integrating and developing report viewers, report designers, and Reporting REST APIs through Copilot. Consider allowing end users without Telerik Reporting experience to also build reports using AI.
In MSSQL, you may use syntax like 'StoredProcedureName;1' to indicate stored procedure versioning, but it is not yet supported by Telerik Reporting.
I use such syntax and need to remove the version to make this work in Telerik Reporting.
It would be great if you also added support for versioning in MSSQL stored procedures.
If you add transparency to a Graph line, for example, the Y-axis, with an alpha value: '150, 255, 255, 192', it is respected in the Standalone Report Designer, where the rendering format is Image.
In the Web Report Designer and in the HTML5 Report Viewer preview, the alpha value is ignored, and the color is rendered as '255, 255, 192', which removes the transparency.
The Initialize method in ReportViewer.cs is called from both the OnLoaded and OnApplyTemplate methods, which in turn calls the AttachModelEventHandlers method. This leads to it adding the event handlers to the model twice every time it is loaded. The DetachModelEventHandlers is only called once (in the OnUnloaded method), so if you keep unloading and reloading the control, it adds 2 event handler invocations but removes only one. This means each one is called at least twice (if you have only loaded the control once), then 3, 4, 5, etc times if you keep unloading and reloading it.
I've worked around this by adding code to my wrapper class to prune the duplicated handlers for now, but this needs fixing in the base code.