Currently, graph axes do not provide a way to render separator lines between category groups. While this is generally not an issue for simple scenarios, it can make charts with nested categories difficult to read.
For example, when a graph displays multiple subcategories under a parent category (such as revenue ranges grouped by quarter), there is no built-in visual indicator showing where one parent category ends and the next begins.
It would be useful to provide support for category separators on graph axes, allowing report authors to visually separate category groups and improve readability when working with hierarchical data.
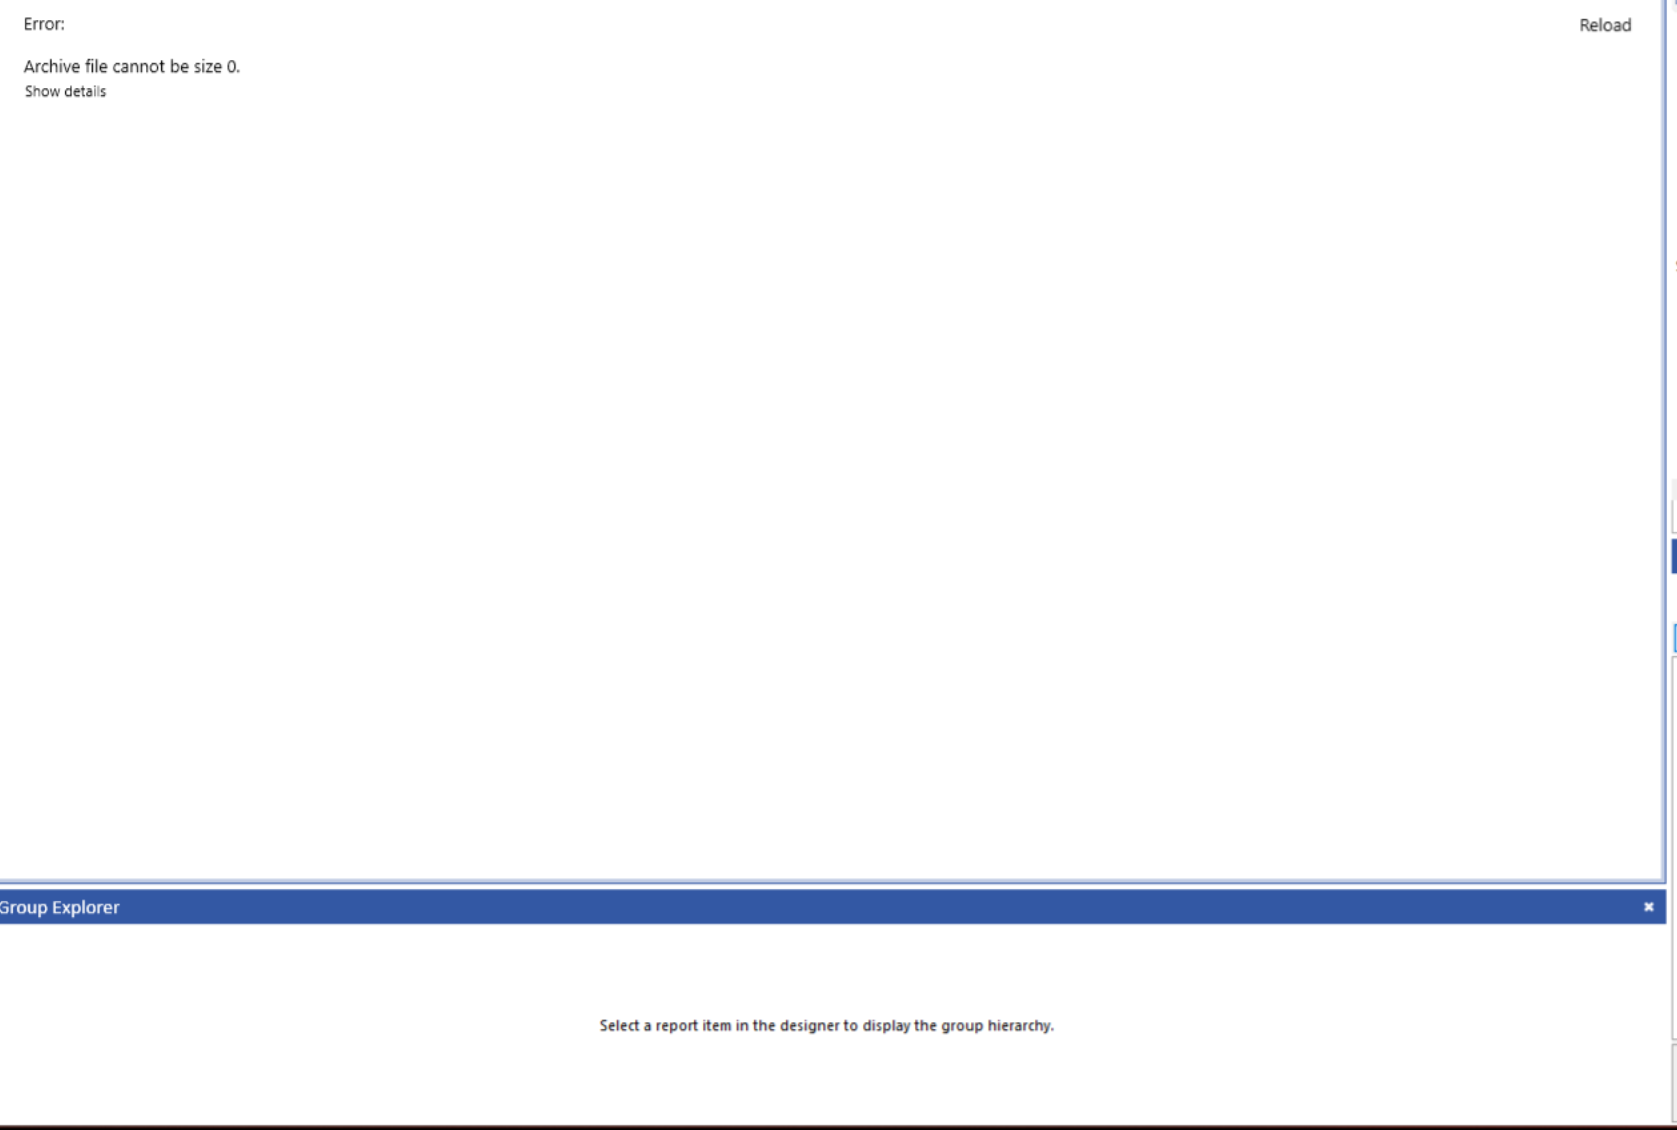
I use the exportBegin event to prevent the default export logic. However, when I do that, the default viewer notification remains, and I have to hide it manually:
                    exportBegin: function (e, args) {
                        args.handled = true; // Set to true to cancel the default export behavior.
                        //...
                        $(".trv-notification").addClass("k-hidden");
                    },
Double-click selection in the expression editor isn't context-aware. In almost every other application, double-clicking selects a token based on its surrounding context — a single field/identifier when clicking on a field, or the word boundary within a string literal when clicking inside quotes. The expression editor doesn't respect these boundaries, so its double-click behaviour is inconsistent with the standard expression-editor behaviour users expect.
Expected: Double-click selects the relevant token based on context (e.g. an individual field reference, or a word within a string literal).
Actual: Double-click selection ignores context and does not match the token/word-boundary behaviour found in virtually all other expression editors and text inputs.
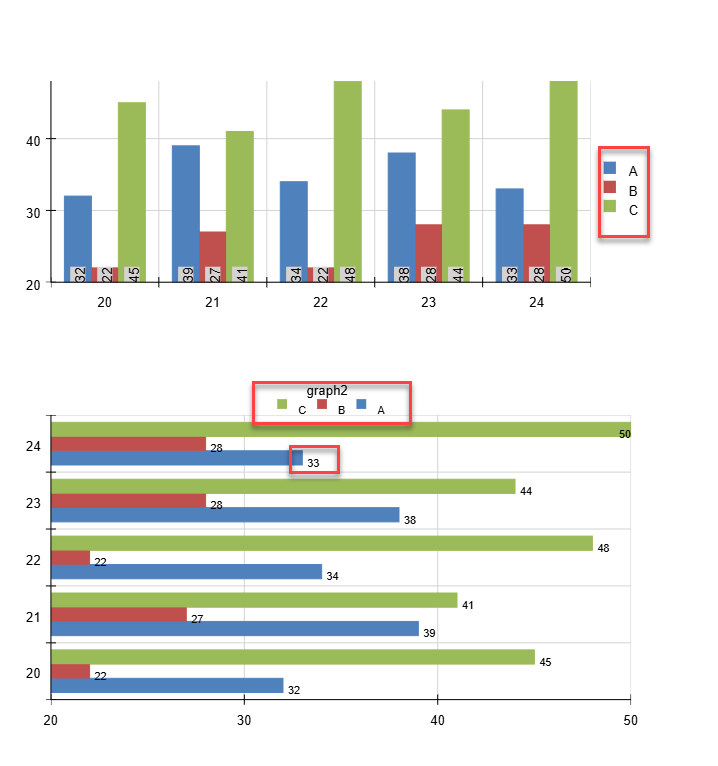
I have graphs in my report. I render them with Skia on Linux. The issue reproduces with Skia on Windows as well.
The legend labels are not aligned well with the color icon, and data labels on a horizontal bar chart (with OutsideEnd) are misaligned as well:
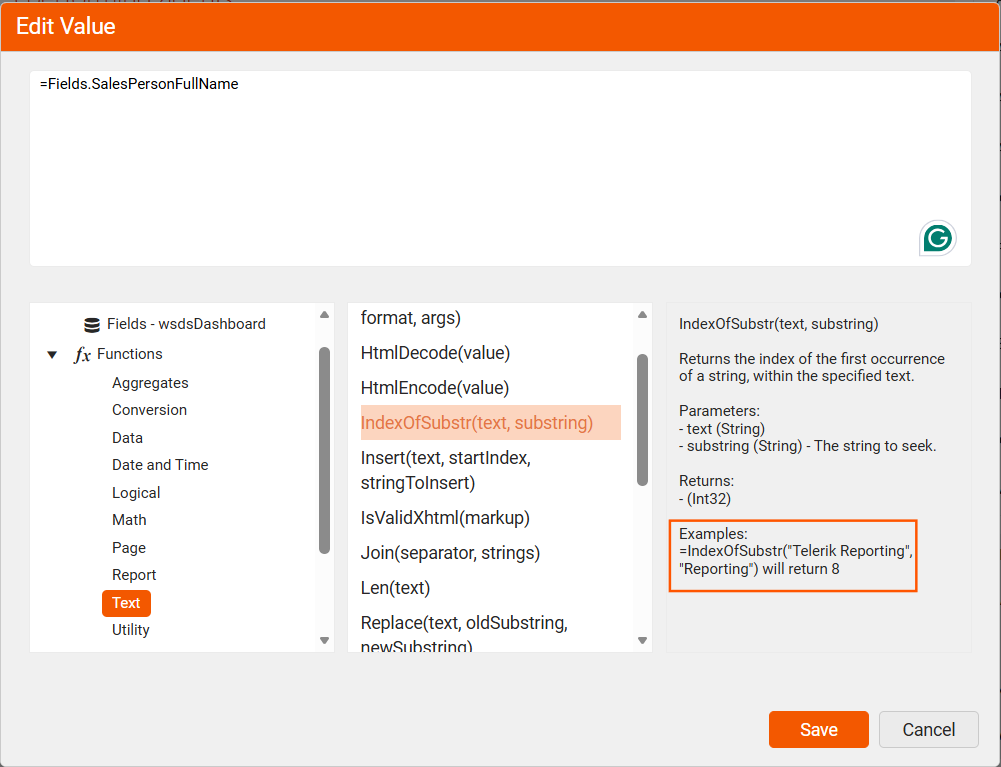
If I open the expression dialog in the Web Report Designer and select one of the available functions, I will see a sample snippet in the third column below the expression area.
This column is not selectable, so I cannot copy the example and test it out. This example should be copyable, so that each function can be easily tested in the report designer.
I have localized a report with a Graph in the 'ar-SA' culture.
When exporting to PDF from the viewer, the report is generated as expected. In the Report Viewer's Preview, though, the Graph Legend and Labels are not correct:
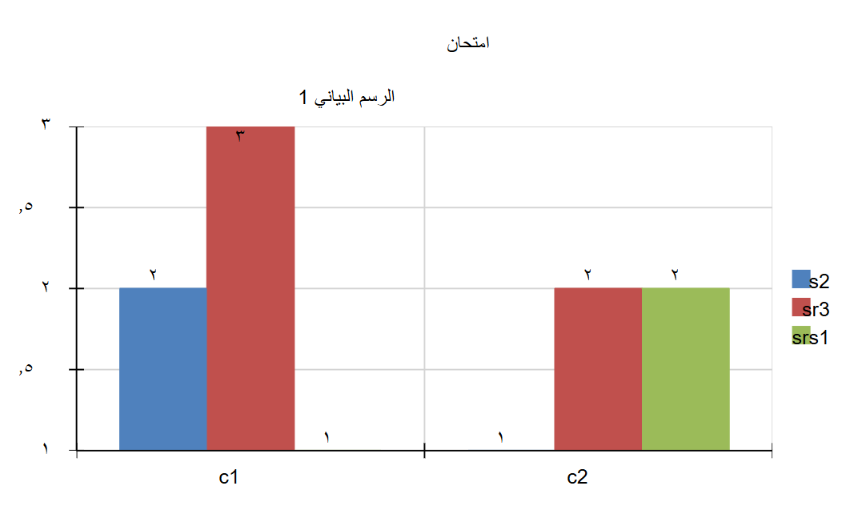
I am using Native Blazor Report Viewer, but the problem also reproduces in the HTML5-based web viewers, with all the themes I have tested.
Request:
Add a RedisStorage constructor overload that accepts StackExchange.Redis.IConnectionMultiplexer rather than only the concrete ConnectionMultiplexer.
Current behavior:
new RedisStorage(ConnectionMultiplexer connectionMultiplexer) requires the concrete type.
Problem:
Modern ASP.NET Core apps manage a single shared multiplexer through DI and expose it as IConnectionMultiplexer — the abstraction recommended by StackExchange.Redis, and the same type
Microsoft.Extensions.Caching.StackExchangeRedis uses via its ConnectionMultiplexerFactory (which returns IConnectionMultiplexer). To call RedisStorage we are forced to downcast our IConnectionMultiplexer back to
ConnectionMultiplexer. This is fragile and it prevents passing test doubles or decorators (e.g. for instrumentation/logging).
Proposed change:
Add RedisStorage(IConnectionMultiplexer connectionMultiplexer), plus a databaseNumber overload (RedisStorage(IConnectionMultiplexer connectionMultiplexer, int databaseNumber)). ConnectionMultiplexer already
implements IConnectionMultiplexer, so this is fully backward-compatible — existing callers that pass a concrete instance keep working unchanged. Everything RedisStorage needs is available on the interface
(GetDatabase for string operations and LockTake/LockRelease, GetSubscriber, GetServer).
Benefits:
- Clean dependency-injection integration with a shared, app-managed multiplexer.
- Unit-testability via a mocked IConnectionMultiplexer.
- Consistency with StackExchange.Redis guidance and Microsoft's own caching abstractions.
Note:
Please target the maintained Telerik.Reporting.Cache.StackExchangeRedis package (the .2 variant appears discontinued after 18.2.24.806 and has no 19.x/20.x release).
Hi Team,
Even after giving the date format facing the inconsistency in the date field for some rows in the table when we export it to CSV file
<TextBox Width="1.036in" Height="0.24in" Left="0in" Top="0in" Value="= Fields.StartDate" Format="{0:MM'/'dd'/'yyyy h:mm tt}" Name="Opened Date">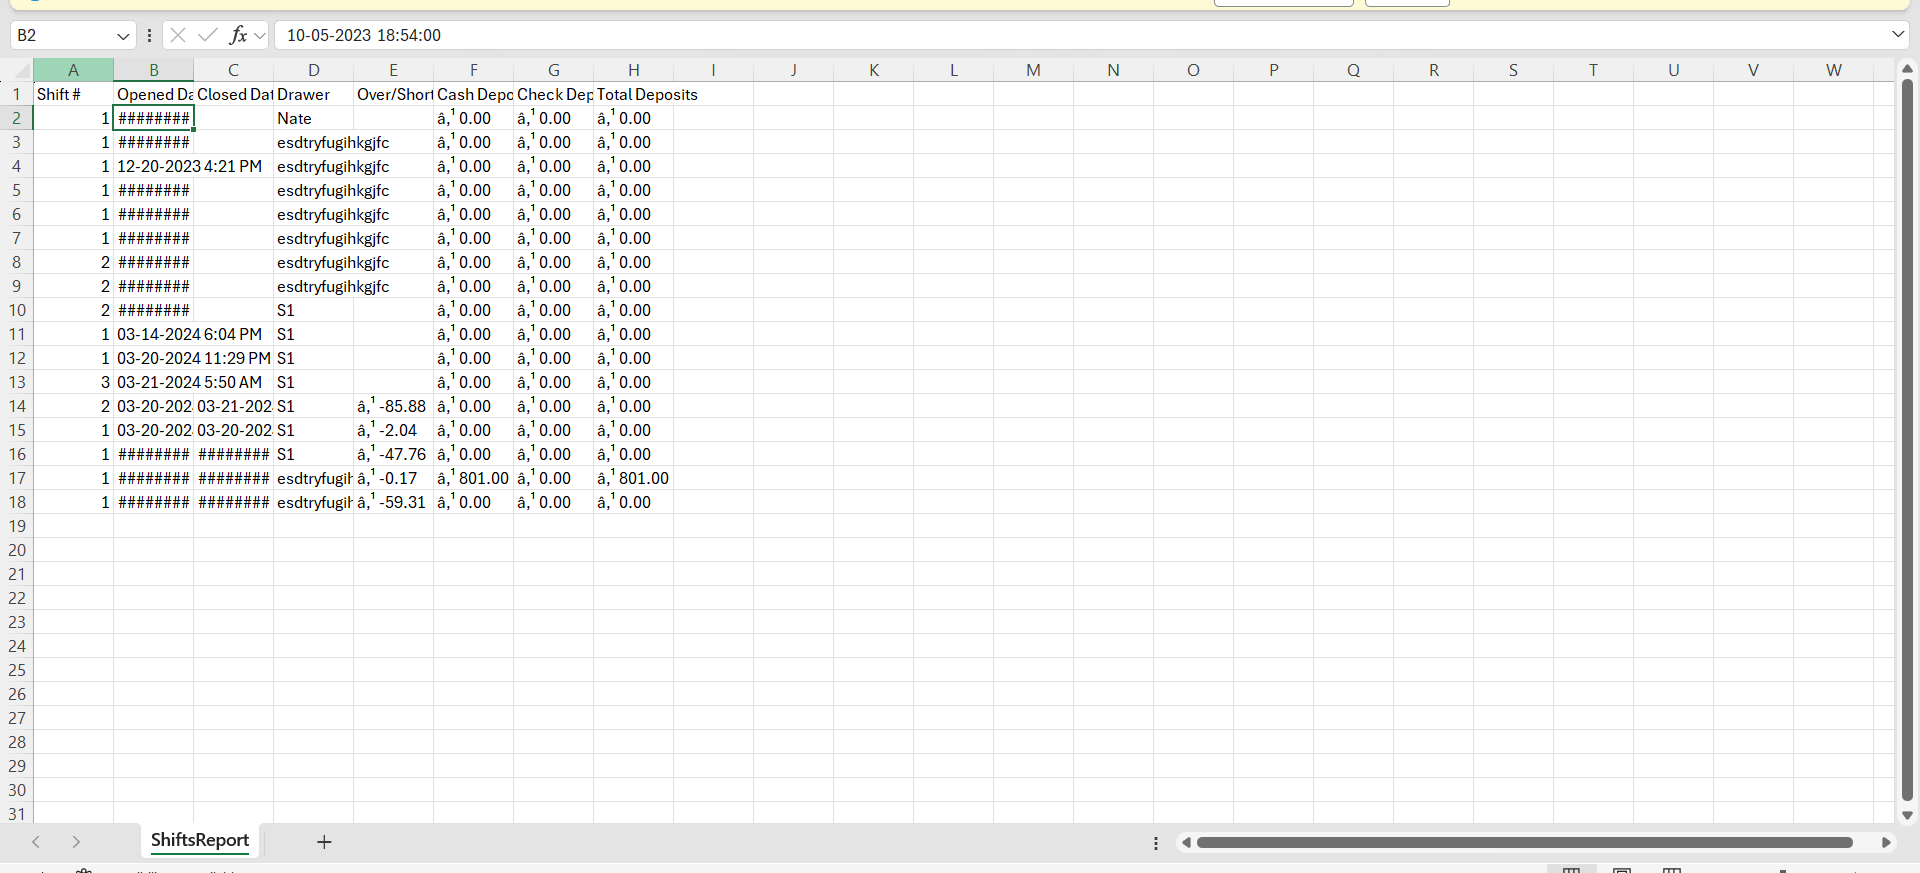
I am trying to use the following HTML content for the HtmlTextBox item:
<span style="font-weight:bold">Label 1:</span> <span>Data 1</span> <span style="font-weight:bold"> Label 2:</span> < span>Data 2</span>
However, the non-breaking space between the spans (label 1/data 1 and label 2/data 2) is not preserved.
I have a custom assembly with default 'version', 'culture', and 'publicKeyToken'.
When I reference the assembly in the 'assemblyReferences' element only with its 'name', the Reporting Engine recognizes it.
If I reference it with the full version, '1.0.0.0', it also works.
However, when I set the 'version' to '1.0.0', the Reporting Engine throws, stating that the assembly is not trusted and must be referenced in the 'assemblyReferences' element.
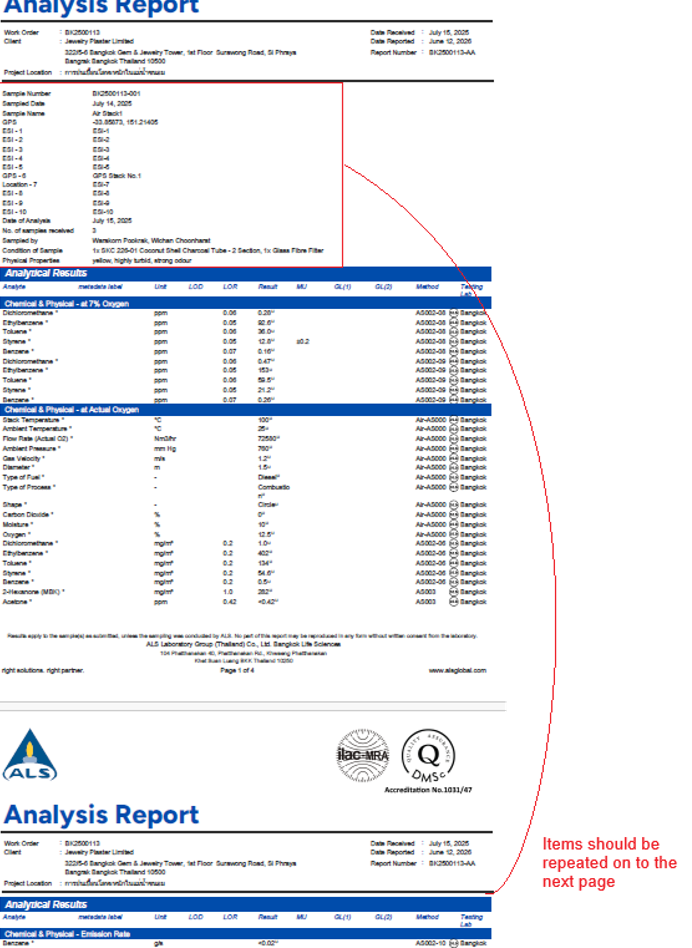
The attached sample has a simple table with two row groups, and "header" rows created via "Insert Row -> Outside Group - above".
The groups have "keep together" set.
But despite this, the header rows render at the bottom of one page, with data rows on the following page. This should never happen, I can't think of any case it would be expected (it would be like having "Chapter 2" at the bottom of a page when the text for it starts on the next page).
I also have a sample with just 1 row group, but with 2 detail rows, and the same thing happens. It only appears to work when there's just 1 row group and 1 detail row.
We have spotted that PInvoke is now marked as deprecated (this applies even to the latest 0.7.124 version). In the description of the PInvoke.User32 NuGet package, it is mentioned that Microsoft.Windows.CsWin32 should be used instead:

Please consider replacing the deprecated package.
greetings
Summary
When the Web Report Designer is initialized with non-English string resources (via window.telerikWebDesignerResources), the authentication type selector in the Web Service Data Source wizard behaves incorrectly. Even though "Sin autenticación" (the translated value of WebServiceDataSourceNoAuthentication) is visually selected in the dropdown, the wizard behaves as if a different authentication type is selected — displaying additional required credential fields and blocking progression.
The issue does not occur when using English string resources (WebServiceDataSourceNoAuthentication = "No authentication").
---
Steps to Reproduce
1. Configure a Blazor Web Report Designer with Spanish (es-CO) custom string resources using window.telerikWebDesignerResources:
// WebReportDesignerStrings.es-CO.js
export class WebReportDesignerStringsBase {
constructor() {
// ...
this.WebServiceDataSourceNoAuthentication = "Sin autenticación";
// ...
}
}
// Load resources before designer renders
window.telerikWebDesignerResources = new WebReportDesignerStringsBase();
2. Open the Web Report Designer in the browser with the Spanish resources active.
3. Add a new Web Service Data Source.
4. In the wizard URL step, observe the authentication selector — it shows "Sin autenticación" as the selected option.
5. Attempt to proceed through the wizard.
---
Expected Behavior
With "Sin autenticación" selected (equivalent to "No authentication"), the wizard should:
- Require only the Service URL field
- Not display credential input panels
- Allow proceeding to the next step without authentication configuration
---
Actual Behavior
Despite "Sin autenticación" being visually selected, the wizard behaves as if a different authentication type (Basic or 2-step) is selected:
- Additional authentication configuration panels appear or are required
- The wizard blocks progression expecting credential inputs
- The behavior is identical to what occurs when "Basic" or "2-step" is selected
---
Root Cause Analysis
The designer's compiled JavaScript (webReportDesigner) appears to compare the selected authentication type against the English string "No authentication" internally, rather than against a stable enum or index value. When the display text is "Sin autenticación", this comparison fails and the wizard falls through to a non-"no auth" code path.
Evidence: applying the temporary workaround of keeping WebServiceDataSourceNoAuthentication = "No authentication" (English text) in the es-CO resources file resolves the issue completely — the wizard functions correctly while all other strings remain in Spanish.
---
Workaround
In the non-English string resources file, keep WebServiceDataSourceNoAuthentication in English:
// workaround: keep English value until Telerik fixes internal comparison
this.WebServiceDataSourceNoAuthentication = "No authentication";
---
Minimal Reproduction
@* ReportEditor.razor *@
@page "/reportEditor"
@using Telerik.WebReportDesigner.Blazor
<WebReportDesigner DesignerId="wrd1"
ServiceUrl="apiReport/reportdesigner" />
// Loaded before designer renders via IJSRuntime.InvokeVoidAsync
window.telerikWebDesignerResources = {
WebServiceDataSourceNoAuthentication: "Sin autenticación",
// ... other keys
};
---
Additional Notes
- Both es-CO and en-US string resource files contain 971 keys each — the issue is not caused by missing keys.
- The designer correctly picks up the localized strings for all other UI elements; the bug is isolated to the authentication dropdown value comparison logic.
- Confirmed on version 19.1.25.521; not tested on earlier versions.
thank for your attention.
have a nice day.