Android.Views.WindowManagerBadTokenException: 'Unable to add window -- token null is not valid; is your activity running?'
When adding a plot band annotation to the date time axis, it is not applied on MacCatalyst and iOS. In addition if using binding, an exception is thrown.
System.ArgumentNullException: Value cannot be null.Parameter name: minimum
at TelerikUI.TKRange..ctor (Foundation.NSObject minimum, Foundation.NSObject maximum)
It works on Android and WinUI
On some chart series like, bar, line, scatter line, etc, the y axis line is hidden. make it visible, as it is on Android and Windows.
Current solution is to use the chart handler changed and set YAxis.Style.LineHidden to false.
public partial class MainPage : ContentPage
{
    public MainPage()
    {
        InitializeComponent();

        this.chart.HandlerChanged += this.Chart_HandlerChanged;
    }

    private void Chart_HandlerChanged(object sender, EventArgs e)
    {
        this.UpdateChart();
    }

    private void UpdateChart()
    {
        var platformView = this.chart.Handler.PlatformView;
#if IOS || MACCATALYST
        var platformChart = (Telerik.Maui.Controls.Compatibility.ChartRenderer.iOS.TKExtendedChart)platformView;
platformChart.YAxis.Style.LineHidden = false;
#endif
    }
}
An exception is thrown when setting the ChartPallete FillColor property. The issue is reproduced on all platforms.
Workaround:
Also set the StrokeColor property.
<telerik:ChartPalette>
    <telerik:ChartPalette.Entries>
        <telerik:PaletteEntry FillColor="Red" StrokeColor ="Yellow"/>
        <telerik:PaletteEntry FillColor="Gray" StrokeColor ="Yellow" />
        <telerik:PaletteEntry FillColor="Blue" StrokeColor ="Yellow"/>
    </telerik:ChartPalette.Entries>
</telerik:ChartPalette>
when using the flowing setup:
<telerik:RadCartesianChart.ChartBehaviors>
                    <telerik:ChartSelectionBehavior x:Name="selection"
                                                    SeriesSelectionMode="None"
                                                    DataPointSelectionMode="Single"
                                                SelectionChanged="selection_SelectionChanged"/>
</telerik:RadCartesianChart.ChartBehaviors>
the selection behavior on data point does not fire on iOS/MacCatalyst on Cartesian series. It works for PieSeries.
Hi Team,
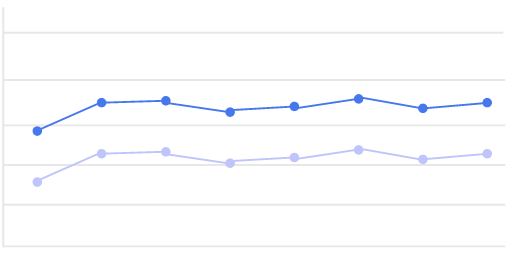
If you create a ScatterPointSeries, the RadLegend does not pick up the series DisplayName value. A replication project is attached, but here's a screenshot to quickly illustrate the behavior:
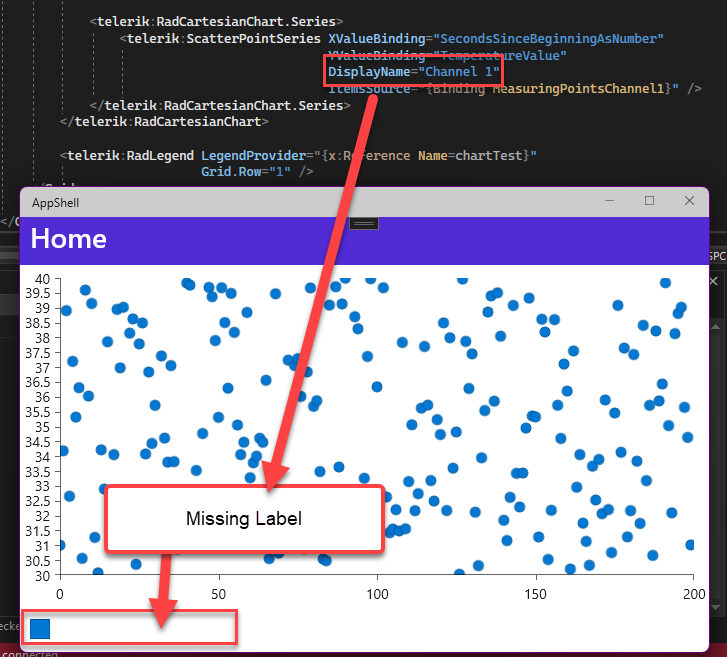
Thank you,
Marion
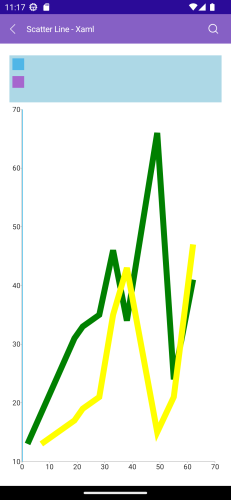
Improve performance when adding many series and data points are constantly added and increased
For example chart slows the performance when 4th series with many data points are added.
For the test, I have used ScatterLine series.
Workaround:
Change the Palette.
ChartPalette chartPalette = new ChartPalette();
chartPalette.Entries.Add(new PaletteEntry { FillColor = Colors.LightBlue, StrokeColor = Colors.LightGreen });
this.chart.Palette = chartPalette;
Hi
I have the following chart
      <telerik:RadPieChart Grid.Row="1">
        <telerik:RadPieChart.Series>
          <telerik:DonutSeries ItemsSource="{Binding CurrencyAllocation}" x:Name="CurrSeries"
                               LabelBinding="Item1"
                               ValueBinding="Item2"
                               ShowLabels="True"
                               AllowSelect="True"
                               SelectedPointOffset="0.1"/>
        </telerik:RadPieChart.Series>
        <telerik:RadPieChart.ChartBehaviors>
          <telerik:ChartSelectionBehavior DataPointSelectionMode="Single"
                                          SeriesSelectionMode="None"
                                          SelectionChanged="Chart_SelectionChanged" />
        </telerik:RadPieChart.ChartBehaviors>
      </telerik:RadPieChart>
As soon as I set the SelectedDataPointOffset to a lowish value, no matter whether it's 0.5, 0.1, 0.01, 0.001 or even 0.0000001, the offset when selecting the data point is always the same and it's so large that it's unusable, as you can see in the following screenshot.
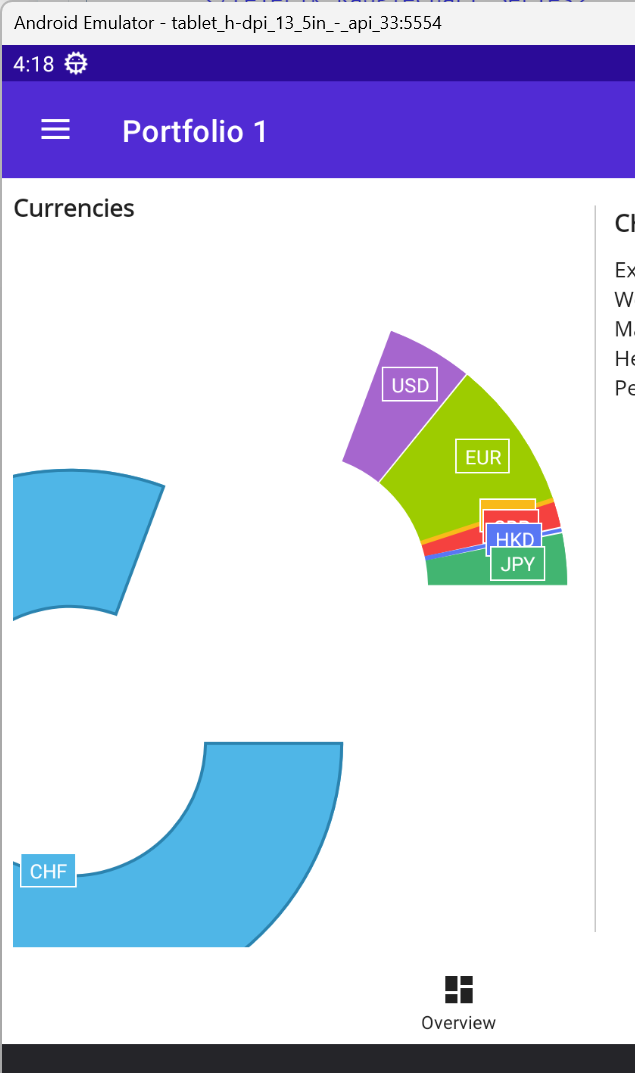
As an additional issue, if i set the offset to 0.9, i get an exception
'RelativeOffsetFromCenter is not valid! The possible values are in the [0, 1] interval.'
as soon as I select a segment. 0.9 obviously is in the [0, 1] interval.
or if the legend is auto wrap when overflow.
On WinUI: Two PieSeries are displayed.
On Android: Crash occurs
On iOS: negative value is displayed in chart
The data points should allow setting shape and color to each one individually.
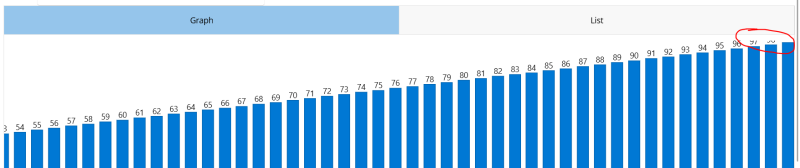
Labels in bar series are cut, when setting the labels VerticalAligment to Top: