Add an option to define chart title.
Currently we can achieve this by adding a label on the top/bottom of the chart.
Example:
<Grid RowDefinitions="Auto,*">
    <Label Grid.Row="0" Text="Chart title"/>
    <telerik:RadCartesianChart x:Name="chart" Grid.Row="1" AutomationId="chart">
        <telerik:RadCartesianChart.BindingContext>
            <local:ViewModel />
        </telerik:RadCartesianChart.BindingContext>
        <telerik:RadCartesianChart.HorizontalAxis>
            <telerik:CategoricalAxis />
        </telerik:RadCartesianChart.HorizontalAxis>
        <telerik:RadCartesianChart.VerticalAxis>
            <telerik:NumericalAxis />
        </telerik:RadCartesianChart.VerticalAxis>
        <telerik:RadCartesianChart.Series>
            <telerik:BarSeries CategoryBinding="Category"
                                ValueBinding="Value"
                                ItemsSource="{Binding Data}" />
        </telerik:RadCartesianChart.Series>
    </telerik:RadCartesianChart>
</Grid>
Hi Team,
I would like to be able to set different cap styles on the bars, like the RadGauge allows you to do on Indicators. For example, I want rounded corners.
Thank you,
John
Hi team,
Currently, I can only set LegendItemFontColor and LegendItemFontSize. I would like to be able to set LegendItemFontFamily
Thank you,
John
I have a RadPieChart in my application. When removing the app from the backstack and service is running, then opening the app from the notification, the app crashes with:
Java.Lang.IllegalStateException: ChildNode is already parented by a ChartElement instance.
Hi Team,
Only on iOS, an app will crash if the CartesianGridLineAnnotation's Value is not set. On Windows and Android, this does not occur.
Example:
<telerik:RadCartesianChart x:Name="chart">
    <telerik:RadCartesianChart.Annotations>
        <!-- PROBLEM: Crashes on iOS due to not have a default value-->
        <telerik:CartesianGridLineAnnotation x:Name="marker" Axis="{x:Reference xAxis}"/>

        <!-- WORKAROUND: Set a default Value -->
        <telerik:CartesianGridLineAnnotation x:Name="marker" Axis="{x:Reference xAxis}" Value="0"/>
    </telerik:RadCartesianChart.Annotations>
</telerik:RadCartesianChart>
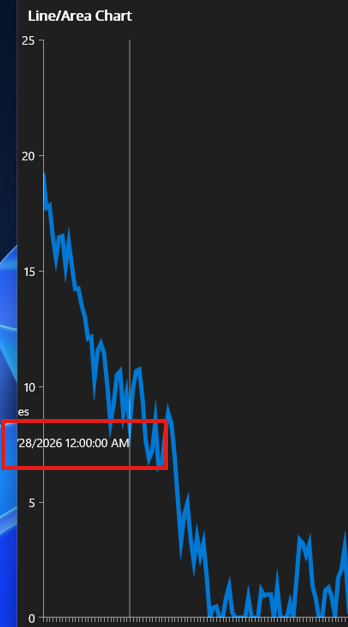
The VisibleRange property can hold the actual visible minimum and maximum of the axis while the chart is being zoomed and panned.
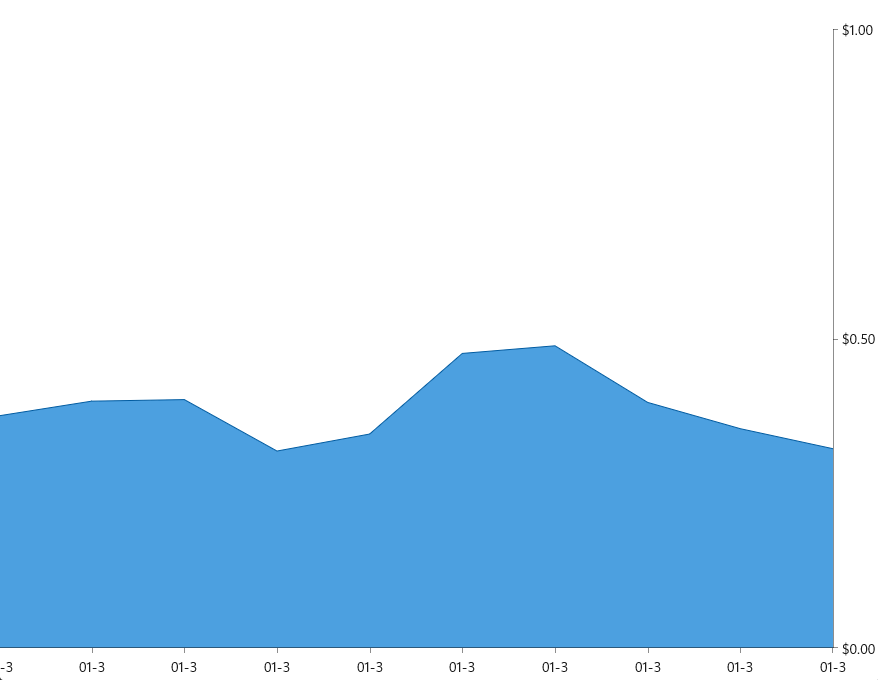
Let's say I set the number of labels to 4 on that axis (see attached pic). It would then be up to the axis to auto generate the labels depending on the data and zoom. There would always be four labels shown on the axis regardless of zoom so the user could always have context regardless of the zoom. The labels would just change to reflect what is currently being viewed at the current zoom level.
NullReferenceException when Chart is added inside Microsoft MAUI CollectionView and navigating back to a page.
Workaround:
When using the Telerik MAUI CollectionView no exception.
Last label on the x axis is clipped, when the y axis is right positioned and x axis plot mode is on ticks.
when trying to display data using the trackball, the tooltip is clipped on left at chart start:
Legend is not fully visualized, the square color is missing, only the text is displayed.
on iOS it seems the issue happens only on simulator, on iPhone device SE 2022 the legend is fully displayed
Series labels are not properly rotated with LabelFitMode set to "Rotate".
On iOS it seems the issue happens only on simulator, on iPhone device the labels are aligned (rotated) as expected.