When a non functional template is used for the labels in the Chart in webpack project, an error is thrown.
- Run the attached sample and observe the behavior.
npm install
npm start
The following error is displayed: labelTemplate is not a function TypeError: labelTemplate is not a function
If the template is removed or replaced with funcitonal template, the Chart displayes as expected
Workaround:
resolve: {
        mainFields: ['es2015', 'es', 'module', 'main', 'browser']
    }
Hi!
I am loading Kendo-UI via npm (@progress/kendo.ui:2025.4.1321). The @progress/kendo-ui package internally references @progress/kendo-charts^2.9.0. At the time I installed kendo-ui, the latest available version of @progress/kendo-charts was 2.11.0, which is why npm chose this one.
However, this version leads to a JS error when rendering bar charts similar to this one:
Error: <g> attribute transform: Expected number, "matrix(NaN,NaN,NaN,NaN,…".This is caused by line 374 in @progress/kendo-charts/dist/es/chart/chart.js (version 2.11.0). It has been added in version 2.10.0. If I am using version 2.9.0 instead (which is also served by the CDN for Kendo-UI 2025.4.1321), everything works fine.
Is there an issue in the supported version ranges of the dependencies of @progress/kendo-ui?
Or does @progress/kendo-charts not follow the rules of semantic versioning?
I would like to avoid pinning the versions of all sub-dependencies of Kendo-UI just to avoid running into such conflicts when running "npm update".
Hi Team,
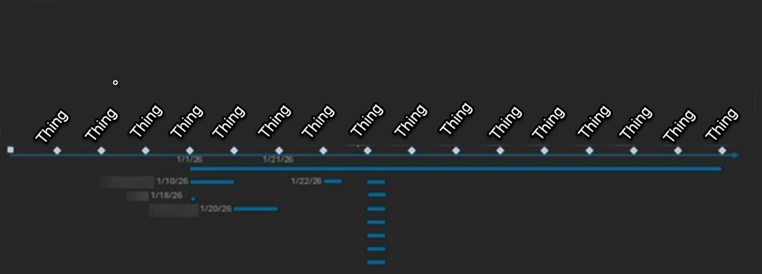
I would like to request a chart which visually displays workflow data similar to a Gantt chart but in pivoted form.
Thank you!
Description
When the points in the ScatterLine chart are unevenly spaced, the resulting line may appear less smooth and have unexpected curve
Steps To Reproduce
- Open the Dojo - https://dojo.telerik.com/AqCtkUxD
Screenshots or video

Actual Behavior
The line may appear with an unexpected curve and is not smooth.
Expected Behavior
When the smooth option is enabled, the line should appear smooth with all the data.
Reported in TicketID: 1703639
Hi Team,
I would like to request a built-in way to set a gradient area between line series.
Thank you!
Hello,
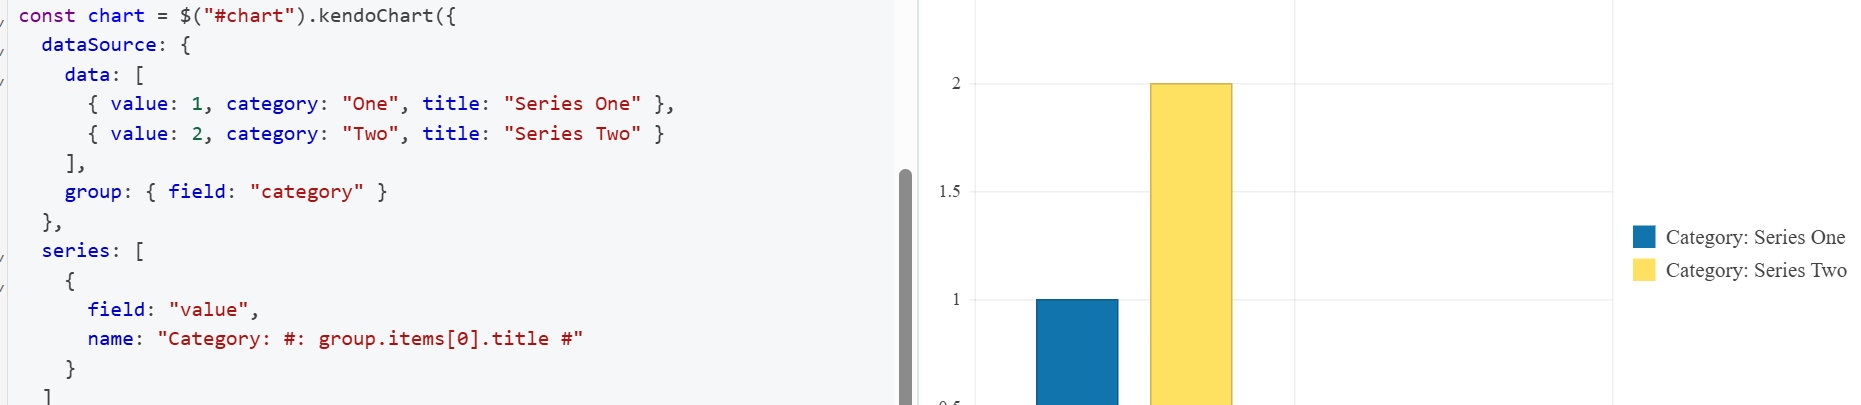
I noticed in some of my charts that when I call saveAsPDF, the series.name seems to be just a literal string of the series.name option, even when I use a template.
Please see the attached dojo to reproduce (I based this dojo off of the Chart API series.name as template dojo example).
https://dojo.telerik.com/ZgsUVIjM
I noticed that this behavior starts in 2024.4.1112. Prior versions evaluated the template for the PDF.
I do have a workaround for this, which is included in comments in my dojo. I just exportPDF and then use kendo.saveAs.
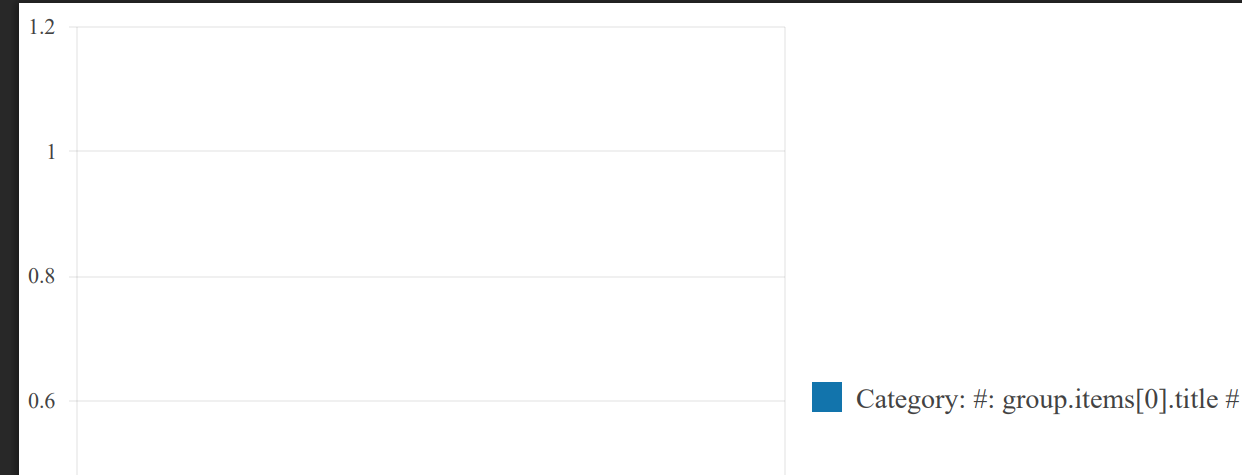
Additionally, I noticed that the bars in the chart are at 0 in the PDF. I'm not worrying about that at this time, I'm exclusively interested in the series.name template being evaluated on saveAsPDF.
Here are some screenshots of the dojo and resulting pdf for v2024.4.1112:
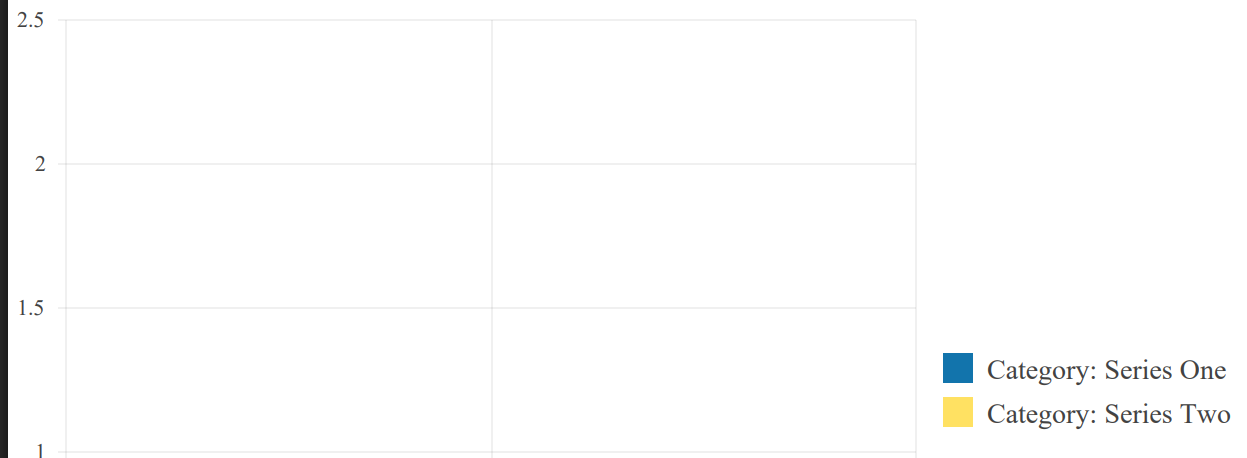
Here is a screenshot of the pdf when the same dojo is run on 2024.3.1015:
Please let me know if you'd rather I paste the dojo code directly into this ticket, or attach as a code file.
Thanks!
-Alexa
Hi Team,
I would like request adding automatic line breaks for Kendo UI Charts to help avoid lengthy labels.
Thanks!
Bug report
Donut Chart Overlay looks different after Q2 2024
Before Q2 2024
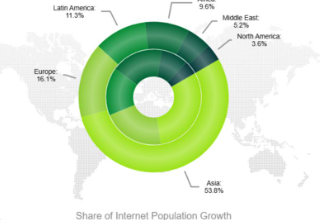
After Q2 2024
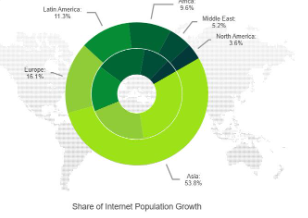
Reproduction of the problem
Dojo demo: https://dojo.telerik.com/GHWBFuzv
Environment
Kendo UI version: 2024.2.514 or newer
Browser: [all]
Hi Team,
I would like to request a way to set the color/type of a series so if it makes a condition, the color/type would change. For example, if the series count reaches a certain amount, change the color of the line, and the type to dash. Perhaps setting the Series.Line.Color as a function would be great.
Thank you!
Bug report
Drawing API Tooltip for categoryAxis Chart labels do not show with v.2024.4.1112
Reproduction of the problem
https://docs.telerik.com/kendo-ui/knowledge-base/tooltip-for-category-axis-labels
Expected/desired behavior
The Charts should be exported to the selected file format
The issue is a regression starting with 2024.4.1112
Environment
jQuery: 3.4.1
Kendo UI version: 2024.4.1112
Browser: [all]
Bug report
Pie and Donut Chart can not be exported to PDF, Png or Jpg
Reproduction of the problem
- Open the demos - https://demos.telerik.com/kendo-ui/pdf-export/index or the Dojo - https://dojo.telerik.com/LfDhdqXf
- Try to export the Chart in any format
Current behavior
The pie and donut charts are missing.
Expected/desired behavior
The Charts should be exported to the selected file format
The issue is a regression starting with 2024.4.1112
Environment
- Kendo UI version: 2024.4.1112
- Browser: [all]
Bug Report
The diagram.exportImage() throws an error with v.2024.4.1112
"Uncaught TypeError: diagram.exportImage(...).done is not a function"
Regression with 2024.4.1112.
Reproduction of the problem
Run the example from the following API: https://docs.telerik.com/kendo-ui/api/javascript/dataviz/ui/diagram/methods/exportimage
Current behavior
The export is not working.
Expected behavior
No error shall be present and image must be generated.
Environment
Kendo UI version: 2024.4.1112
jQuery version: x.y
Browser: [all]
Hi Team,
Currently, the Kendo UI Chart's legend labels and Drawing API offers font property, which includes style, size and family only, as described in CSS documentation. Needs underline and strikethrough, which are considered "decorations" on the font in CSS, but seems like since these attributes exist already in editor, the code is around there somewhere. Would like to see either font include support for those attributes or another "decorations" attribution (or maybe underline attribute and strikethrough attributes if that's easier for people to understand).
Thank you!
Description: When 'shared' tooltip is enabled (tooltip: {shared: true}) keyboard navigation through chart triggers JavaScript error and tooltip on focus is not shown, neither shared nor regular tooltip. It works without issues when 'shared' is disabled, but when it is enabled errors are triggered.
Steps to reproduce:
- Open Dojo example https://dojo.telerik.com/@oleksii.shumakov@thomsonreuters.com/UqixUyuj
- Open browser's console (F12)
- Run the script
- With mouse click on "India" legend item once -> India line is disabled
- Click on "India" legend item once more -> India line is enabled
- Using keyboard hit Shift+Tab -> Browser's console shows error: "Uncaught TypeError: Cannot read properties of undefined (reading 'format')"
- Using keyboard hit Tab -> Dot on chart line becomes highlighted but no tooltip is shown
Stack trace of the issue:
kendo.all.js:290271 Uncaught TypeError: Cannot read properties of undefined (reading 'format')
    at init.show (kendo.all.js:290271:1)
    at init._displayTooltip (kendo.all.js:302830:1)
    at init._focusFirstPoint (kendo.all.js:302653:1)
    at init._navigatePoints (kendo.all.js:302577:1)
    at init._keydown (kendo.all.js:302540:1)
show @ kendo.all.js:290271
_displayTooltip @ kendo.all.js:302830
_focusFirstPoint @ kendo.all.js:302653
_navigatePoints @ kendo.all.js:302577
_keydown @ kendo.all.js:302540
Versions of KendoUI with the issue: 2024.2.514, 2024.3.806
Dear support team,
we are facing an issue when trying to use "setOptions" to update a Chart.
It works fine when using a normal bar chart but seems to be broken when using stacked bars:
https://dojo.telerik.com/AKEWaLIR
Are we doing something wrong or is this a bug?
Charts support keyboard navigation. Currently, the focus indicator is rendered as a thick black border around the different chart items. Is there any way to customize it? We usually use dashed red borders throughout our application to indicate focused elements and it would be great to stay consistent.
I found this article which leverages the highlight and saw that the series.highlight.toggle setting allows modifying the highlight's visual element, but options are very limited and do not allow sufficient customization.
Chart Series provide a toggleVisibility() method that allows to hide some data points of the series (or all of them) from the user. However, setting the first series to invisible breaks the chart's keyboard navigation.
This DOJO demonstrates the behavior: For the sake of simplicity, the first of the two series is toggled invisible right after the chart is rendered, but this may happen at any other point in time. Click anywhere in the DOJO's output area. Press TAB to focus the chart. The following error is logged in the browser console:
Uncaught TypeError: Cannot read properties of undefined (reading 'options')
    at init.focusVisual (kendo.all.min.js:9:4230266)
    at init._focusElement (kendo.all.min.js:9:4410242)
    at init._focusFirstPoint (kendo.all.min.js:9:4409100)
    at init._focus (kendo.all.min.js:9:4407358)
In Excel, there is an option for Sparkline to set a marker for the highest point, lowest point, first point, last point, and negative point.
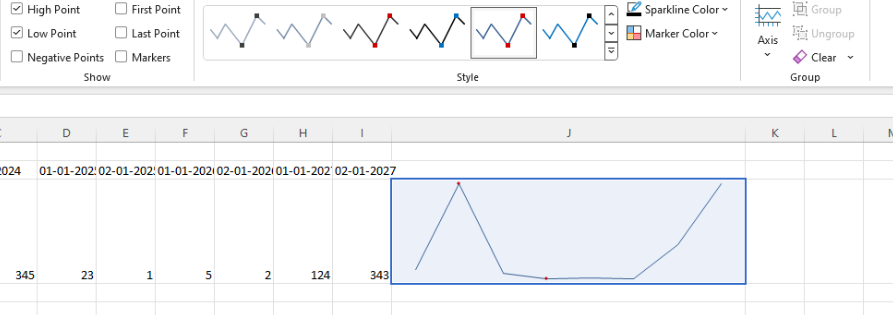
I know that it is possible to customize the appearance of the markers using the markers.visual. However, I would like to have the option as a built-in configuration to ensure better performance.
Bug Report
When the zIndex is set the the chart marker in the legend is misaligned.
Reproduction of the problem
- Open the Dojo - https://dojo.telerik.com/@NeliK/OCEtoRuz
Current behavior
The line and the marker in the legend are misaligned.

Expected/desired behavior
The line and the marker should be aligned even when the zindex is set.

Environment
- Kendo UI version: 2024.1.319
- Browser: [all ]
Bug report
The stack bar chart is not rendered as expected when stack.type is set
Reproduction of the problem
- Open d the Demos - https://demos.telerik.com/kendo-ui/bar-charts/stacked100-bar or the API
- https://docs.telerik.com/kendo-ui/api/javascript/dataviz/ui/chart/configuration/series.stack#seriesstacktype
- https://docs.telerik.com/kendo-ui/api/javascript/dataviz/ui/chart/configuration/seriesdefaults.stack.type
Current behavior
The Chart is not rendered correctly, the bars are misaligned.
Expected/desired behavior
The bars should be aligned.
Regression: The issue is reproducible starting with 2024.1.130 version
Environment
- Kendo UI version: 2024.1.130
- Browser: [all ]