It would be great if the SkiaImageExportSettings offer a DocumentUnhandledException event allowing the developer to handle specific errors when exporting to image formats.
This would be an essential improvement in the existing Exception handling mechanism and would enable exporting PDF documents to images even though some parts of the image may not be completely supported: https://docs.telerik.com/devtools/document-processing/libraries/radpdfprocessing/features/handling-document-exceptions
The PDF/A-1 standard uses the PDF Reference 1.4 and specifies two levels of compliance:
- PDF/A-1b - Its goal is to ensure reliable reproduction of the visual appearance of the document.
- PDF/A-1a - Its objective is to ensure that documents content can be searched and re-purposed. This compliance level has some additional requirements:
- Document structure must be included.
- Tagged PDF.
- Unicode character maps
- Language specification.
Since the PdfProcessing and its PdfFormatProvider is compliant with the PDF Reference 1.7. , the produced documents are created with this version as well:

Provide the ability to work with images in headers/footers of a worksheet. Note that large images put in headers are visualized as watermarks on printing/exporting to PDF.
Watermark in Excel: https://support.office.com/en-us/article/add-a-watermark-in-excel-a372182a-d733-484e-825c-18ddf3edf009
In the 2025 version of the Documents packages, "TimeSpan? timeout" were added to a number of interfaces, with the old versions obsoleted, for example: IWorkbookFormatProvider.Import & IWorkbookFormatProvider.Export.
This is a very strange choice, because this limits the flexibility of the interfaces for no reason at all. By only providing the TimeSpan parameter and not a CancellationToken is currently impossible to cancel the operation because e.g. an API request was canceled.
Internally these methods are implemented by first creating a cancellation token using
using CancellationTokenSource cancellationTokenSource = CancelationTokenSourceFactory.CreateTokenSource(timeout);the token from this CancellationTokenSource is then passed to a protected method. Because this internal method uses a CancellationToken anyway, there is practically 0 development cost to exposing this in the interface, which makes the choice not to do so even more confusing.
The interfaces should expose methods that take a CancellationToken instead of a TimeSpan. This would allow for the same functionality as the TimeSpan parameter, by simply passing a cancellation token with a CancelAfter set with a TimeSpan, and an extension method could be provided for the interface which does exactly that, so users can still call these methods with a TimeSpan parameter if they wish to do so for convenience.
Please, in the next version, make these interfaces methods like this:
Workbook Import(Stream input, CancellationToken cancellationToken = default);
void Export(Workbook workbook, Stream output, CancellationToken cancellationToken = default);
and, for convenience, add extension methods for these like this:
public static class WorkbookFormatProviderExtensions
{
    public static Workbook Import(this IWorkbookFormatProvider workbookFormatProvider, Stream input, TimeSpan? timeout)
    {
        using CancellationTokenSource cancellationTokenSource = CancelationTokenSourceFactory.CreateTokenSource(timeout);
        return workbookFormatProvider.Import(input, cancellationTokenSource.Token);
    }
}
Affected interfaces I've run into so far:
- Telerik.Windows.Documents.Spreadsheet.FormatProviders.IWorkbookFormatProvider
- Telerik.Windows.Documents.Common.FormatProviders.IFormatProvider<T>
There may be more with this same pattern, I haven't checked.
Add support for pivot tables.
Purpose: Long-term archiving of electronic documents with full semantic structure.
- "A" for Archiving
Level "1a" ensures:
Tagged PDF (with proper logical structure and reading order)
Unicode text for proper text extraction and searchability
Embedded fonts (for consistent rendering)
Restrictions:
No audio/video
No encryption
No JavaScript
No external content (everything must be self-contained)
Based on: PDF 1.4 (Acrobat 5)
type of shading to be used, the geometry of the area to be shaded, and the geometry of the gradient fill. Various shading types are available, depending on the value of the dictionary’s ShadingType entry:
- Coons patch meshes (type 6) construct a shading from one or more color
patches, each bounded by four cubic Bézier curves.
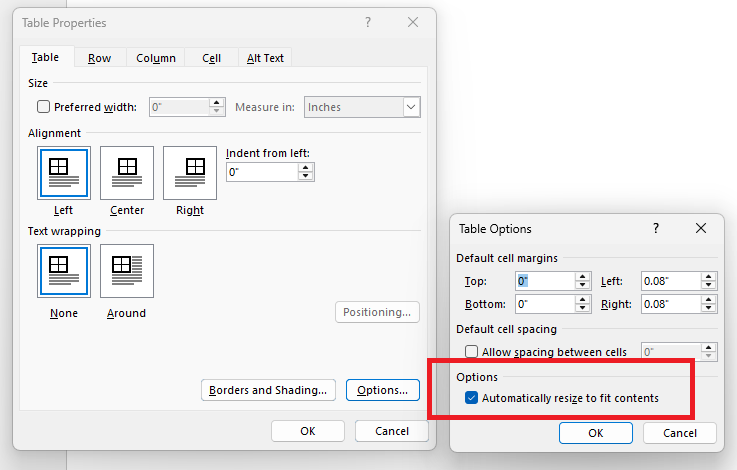
PdfFormatProvider: Add support for the "Automatically resize to fit contents" table property.
The COUNTA function counts cells containing any type of information, including error values and empty text ("")
https://support.microsoft.com/en-us/office/counta-function-7dc98875-d5c1-46f1-9a82-53f3219e2509
Introduce Sanitize Document functionality.
https://experienceleague.adobe.com/en/docs/document-cloud-learn/acrobat-learning/advanced-tasks/redact
https://helpx.adobe.com/acrobat/using/removing-sensitive-content-pdfs.html