This is preserved in the xml once saved from MS Excel:
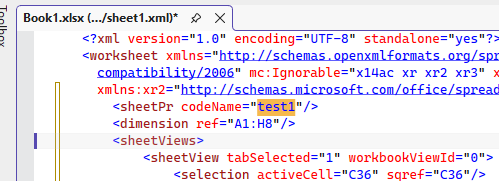
The current formula:
<c r="A1" s="1">
<f>[1]BILANS_JI!$C$2</f>
<v>22611518.026189998</v>
</c>
• Simple direct reference to a single external cell [1]BILANS_JI!$C$2
• No function, just a linked cell
The expected value to be returned is 22611518.
LocalizableException is thrown after removing columns from a workbook with set Print Titles.
Workaround - Remove the PrintTitles before removing the columns:
WorksheetPageSetup pageSetup = workbook.ActiveWorksheet.WorksheetPageSetup;
pageSetup.PrintTitles.RepeatedRows = null;
pageSetup.PrintTitles.RepeatedColumns = null;
Provide the ability to work with images in headers/footers of a worksheet. Note that large images put in headers are visualized as watermarks on printing/exporting to PDF.
Watermark in Excel: https://support.office.com/en-us/article/add-a-watermark-in-excel-a372182a-d733-484e-825c-18ddf3edf009
Currently, the numbers in a CSV file are parsed as numbers, and the leading zeros are lost. In MS Excel, leading zeros could be preserved when the values are imported as text using the more sophisticated text import wizard (http://www.upenn.edu/computing/da/bo/webi/qna/iv_csvLeadingZeros.html ).

Workaround: The values could be extracted using a third-party (or custom) CSV parser, and inserted manually into the model, using CellSelection.SetValueAsText method (http://docs.telerik.com/devtools/document-processing/libraries/radspreadprocessing/working-with-cells/cell-value-types.html ).
Add support for pivot tables.
Currently, RadSpreadProcessing supports the following options:
namespace Telerik.Windows.Documents.Model.Drawing.Charts
{
/// <summary>
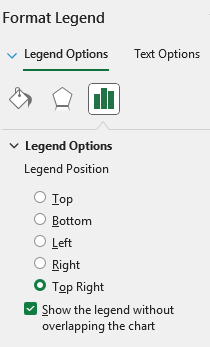
/// Specifies where a chart legend is placed relative to the plot area.
/// </summary>
public enum LegendPosition
{
/// <summary>
/// Positions the legend to the right of the plot area.
/// </summary>
Right,
/// <summary>
/// Positions the legend below the plot area.
/// </summary>
Bottom,
/// <summary>
/// Positions the legend to the left of the plot area.
/// </summary>
Left,
/// <summary>
/// Positions the legend above the plot area.
/// </summary>
Top
}
}MS Excel supports setting "Top Right" Legend Position:
Currently, if you have a decimal column in the DataTable, it is imported as a text column in the workbook. It should be preserved as a numeric column after importing.
Note: When importing a DataTable, each of the column's type is checked and a respective cell type is imported.
 if (dataType.IsValueType && dataType.IsPrimitive && !dataType.IsEnum)
                    {
                        newValue = new NumberCellValue(Convert.ToDouble(value));
                    }
The check ensures only “simple” CLR value types are treated as numbers when importing from DataTable to the worksheet.• IsValueType: filters out reference types.
• IsPrimitive: narrows to CLR primitives (sbyte, byte, short, ushort, int, uint, long, ulong, float, double, char, IntPtr, UIntPtr, bool).
• !IsEnum: excludes enums.
In this code path, primitives are interpreted as numeric and converted to a Double for NumberCellValue. This avoids trying to numeric-convert arbitrary structs (e.g., guid, TimeSpan, custom structs), which should not be treated as numbers.
Decimal is not primitive, so it falls back to text, losing numeric semantics. This is the reason for the observed behavior.
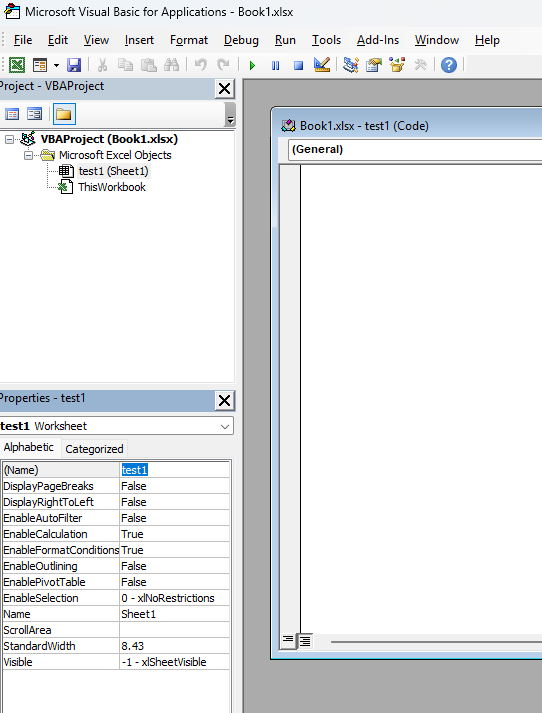
   at System.ThrowHelper.ThrowArgumentNullException(ExceptionArgument argument)
   at System.Collections.Generic.Dictionary`2.FindValue(TKey key)
   at System.Collections.Generic.Dictionary`2.ContainsKey(TKey key)
   at Telerik.Windows.Documents.Spreadsheet.FormatProviders.OpenXml.Xlsx.Model.Elements.Worksheets.ConditionalFormattingRuleElementX14.OnAfterRead(IXlsxWorksheetImportContext context) in C:\Work\document-processing\Documents\Spreadsheet\FormatProviders\OpenXml\Xlsx\Model\Elements\Worksheets\ConditionalFormatting\x14\ConditionalFormattingRuleElementX14.cs:line 62
            string inputFileName = "input.xlsx";
            if (!File.Exists(inputFileName))
            {
                throw new FileNotFoundException(String.Format("File {0} was not found!", inputFileName));
            }

            Telerik.Windows.Documents.Spreadsheet.Model.Workbook workbook;
            IWorkbookFormatProvider formatProvider = new Telerik.Windows.Documents.Spreadsheet.FormatProviders.OpenXml.Xlsx.XlsxFormatProvider();

            using (Stream input = new FileStream(inputFileName, FileMode.Open))
            {
                workbook = formatProvider.Import(input, TimeSpan.MaxValue);
            }
            string outputFilePath = "output.xlsx";

            using (Stream output = new FileStream(outputFilePath, FileMode.Create))
            {
                formatProvider.Export(workbook, output, TimeSpan.MaxValue);
            }
Process.Start(new ProcessStartInfo() { FileName = outputFilePath, UseShellExecute = true });This causes issues when calculating element positions in a custom WorksheetUILayerBase in the context of RadSpreadsheet for WPF.