Can the dev team comment on any known reasons why Charts (I think both SVG and Canvas) might not display when a blazor page is rendered from an automation tool like Chromium, Puppeteer, etc.? (e.g., https://developers.google.com/web/tools/puppeteer).
I have a standard blazor page that I can manually from a standard Chrome window, and it works fine and the Telerik chart displays.
But the same page, when launched either headless or with a GUI browser window, from a tool like Chromium or Puppeteer (with javascript enabled of course), it seems like the DOM is never dynamically updated to include the chart.
I would like to be able to stack series on a range chart. Currently the best hack recommended by Telerik is to show two charts on top of one another, with no interactivity or legends, https://blazorrepl.telerik.com/wHPclTFm28WuoSOp57.
Source: Is it possible to 'stack' series in a Range Column Chart? in UI for Blazor | Telerik Forums
Thank you
Currently, scatter line plots do not support the stepped line style. This is something that would be hugely beneficial to us in our heavy utilization of scatter line plots with time series data.

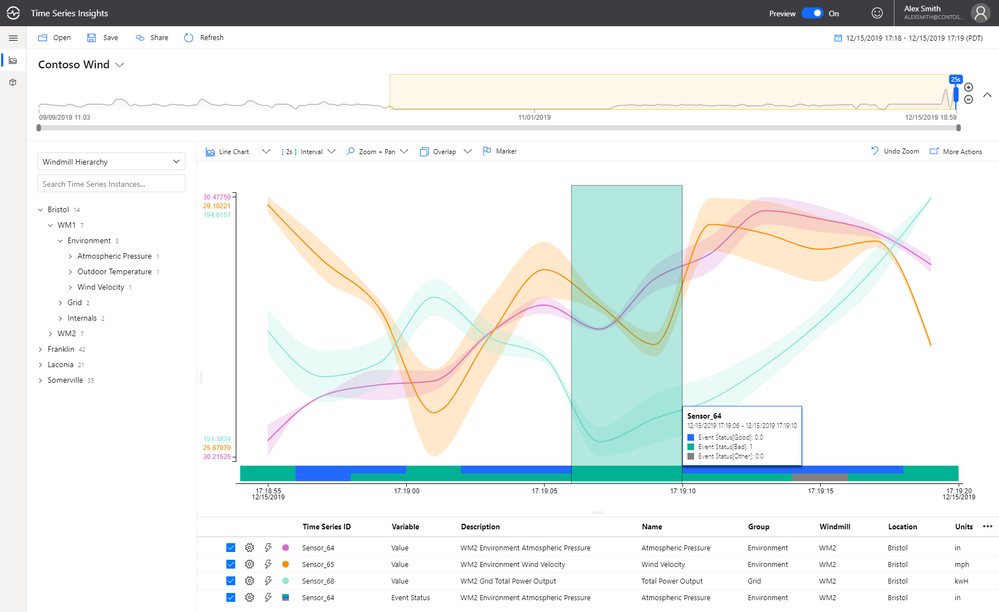
It would be fantastic to be able to visualize boolean data on a time based chart. We have a lot of time series data, and a good bit of it is boolean. It would be very beneficial to be able to plot that data along side our numeric data to provide context to both.
Example (blue/green bar at bottom of chart):
The Chart Tooltip does not render correct values for the data points when the chart is bound to a model, has multiple series and Template is used. The DataItem does not seem to work as expected.
ADMIN EDIT:
If the Chart is bound with Independent Series Binding the FormattedValue will get the correct values.
If the Chart has no Template the correct values for the data points will be displayed
I have a line chart I am using to plot two related series of data. When these two series have the same values, or very similar values, the series that is second in the render order completely covers up the first line. This makes it look like the first line isn't being rendered, and makes it impossible to access the tooltips for the first series. I need a way to disambiguate overlapping data.
Thank you
When a Chart Series has a click handler defined, I think the cursor should be set to 'pointer' when the user is hovering over the series so the user knows its clickable. Currently the Chart Series Labels change to a pointer cursor when you hover them, however they are not clickable. Not sure if this was the intended functionality, but it seems backwards to me.
Hello support team,
from the donut chart example under https://demos.telerik.com/blazor-ui/chart/donut-chart:
Is there a specific reason why all charts have a Template sub-property for the ChartSeriesTooltip construct but the Template field with the template syntax for the ChartSeriesLabels construct? I would favour a unified syntax for both of the properties, if this is possible somehow...
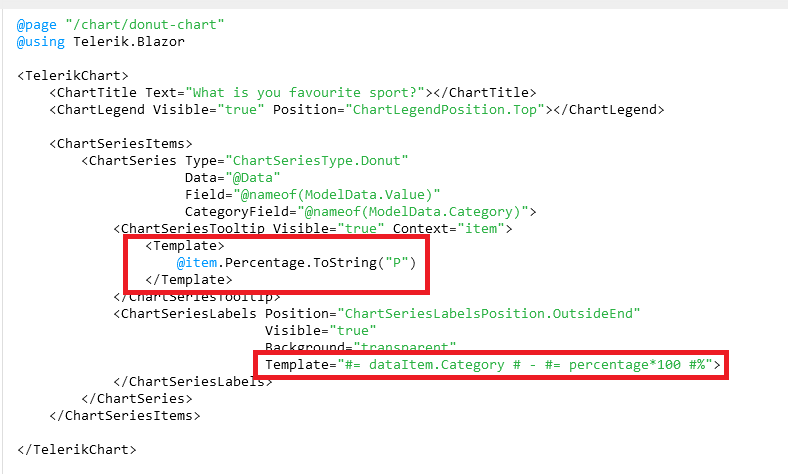
Is this planned for the future to be unified? Especially formatting like shown under https://docs.telerik.com/blazor-ui/knowledge-base/chart-format-percent is not as simple as I would have expected as nobody wants to touch JavaScript code literally :D (Also, localizing data seems quite difficult with that technique).
The best option in my opinion would be to remove those templates completely and just let the user decide what to show there while using a field called e.g. TooltipMappingName and LabelMappingName or something like that. This gives the chart the maximum of configuration possible.
Example:
<TelerikChart>
    <ChartTitle Text="What is you favourite sport?"></ChartTitle>
    <ChartLegend Visible="true" Position="ChartLegendPosition.Top"></ChartLegend>

    <ChartSeriesItems>
        <ChartSeries Type="ChartSeriesType.Donut"
                     Data="@Data"
                     Field="@nameof(ModelData.Value)"
                     CategoryField="@nameof(ModelData.Category)">
            <ChartSeriesTooltip Visible="true" Context="item" TooltipMappingName="@nameof(ModelData.Tooltip)"/>
            <ChartSeriesLabels Position="ChartSeriesLabelsPosition.OutsideEnd"
                               Visible="true"
                               Background="transparent"
                               LabelMappingName="@nameof(ModelData.Label)">
            </ChartSeriesLabels>
        </ChartSeries>
    </ChartSeriesItems>

</TelerikChart>

@code {
    public class ModelData
    {
        public string Category { get; set; }
        public int Value { get; set; }
  public string Tooltip { get; set; }
        public string Label { get; set; }
    }

    public List<ModelData> Data = new List<ModelData>()
    {
        new ModelData()
        {
            Category = "Football",
            Value = 35,
   Tooltip = "35%",
   Label = "Football: 35%"
        },
        new ModelData()
        {
            Category = "Basketball",
            Value = 25,
   Tooltip = "25%",
   Label = "Basketball: 25%"
        },
        new ModelData()
        {
            Category = "Volleyball",
            Value = 20,
   Tooltip = "20%",
   Label = "Volleyball: 20%"
        },
        new ModelData()
        {
            Category = "Rugby",
            Value = 10,
   Tooltip = "10%",
   Label = "Rugby: 10%"
        },
        new ModelData()
        {
            Category = "Tennis",
            Value = 10,
   Tooltip = "10%",
   Label = "Tennis: 10%"
        }
    };
}
Best regards,
Christian
Hi,
We tried making the name property of our TelerikChartSeries dynamic by binding it to a string value. This however seems to completely crash startup, the browser tab freezes and the console doesn't show any errors. If we just put in a simple string in the Name property the application runs without a problem.
<TelerikChartSeries Type="ChartSeriesType.Column" Name="@Team1Name" Data="@Results" Field="@nameof(ChartViewModel.Team1Score)" CategoryField="@nameof(ChartViewModel.CategoryName)">
    <TelerikChartSeriesLabels Visible="true" />
</TelerikChartSeries>
As you can see in this example we're binding the Name property to Team1Name which can be changed whenever another team is selected from a dropdownlist.
Thank you in advance.