Unplanned
Last Updated: 04 Jun 2021 14:34 by ADMIN
Currently on iOS the PanOffset is reset when the underlying data is updated, while the same behavior is not observed on Android.
Unplanned
Last Updated: 14 Jun 2021 04:48 by ADMIN

Annotation (Grid line ) for the DateTimeContinuousAxis is not visualized on iOS. It works as expected on Android.

Add grid line annotation for the datetime axes. the grid lines are not visualized on iOS. 

<telerikChart:RadCartesianChart x:Name="chart">
    <telerikChart:RadCartesianChart.BindingContext>
        <local:ViewModel />
    </telerikChart:RadCartesianChart.BindingContext>
    <telerikChart:RadCartesianChart.HorizontalAxis>
        <telerikChart:DateTimeContinuousAxis LabelFitMode="Rotate" 
                                                x:Name="horizontal"/>
    </telerikChart:RadCartesianChart.HorizontalAxis>
    <telerikChart:RadCartesianChart.VerticalAxis>
        <telerikChart:NumericalAxis />
    </telerikChart:RadCartesianChart.VerticalAxis>
    <telerikChart:RadCartesianChart.Series>            
        <telerikChart:SplineSeries ValueBinding="Value"
                                    CategoryBinding="Date"
                                    ItemsSource="{Binding Data}"
                                    ShowLabels="True"
                                    />
    </telerikChart:RadCartesianChart.Series>
    <telerikChart:RadCartesianChart.Annotations>
        <telerikChart:CartesianGridLineAnnotation Stroke="#0E72F6" 
                                                StrokeThickness="2"
                                                Value="{Binding Threshold}"
                                                Axis="{x:Reference horizontal}">
            <telerikChart:CartesianGridLineAnnotation.DashArray>
                <x:Array Type="{x:Type x:Double}">
                    <x:Double>4.0</x:Double>
                    <x:Double>2.0</x:Double>
                </x:Array>
            </telerikChart:CartesianGridLineAnnotation.DashArray>
        </telerikChart:CartesianGridLineAnnotation>
    </telerikChart:RadCartesianChart.Annotations>
</telerikChart:RadCartesianChart>  


Workaround: 
Use CategoricalAxis.

Unplanned
Last Updated: 06 May 2021 12:57 by ADMIN
When the tooltip is displayed at a certain data point and the data is updated from code-behind, the tooltip stays with wrong data. The expected behavior is the tooltip to be hidden in such case.
Unplanned
Last Updated: 03 Mar 2021 09:27 by ADMIN
Support the ability to apply palette (separate color) per point for a line series.
Unplanned
Last Updated: 17 Feb 2021 10:24 by ADMIN
Created by: Milos
Comments: 0
Category: Chart
Type: Feature Request
0
Provide an option to drag and drop chart annotations.
Unplanned
Last Updated: 17 Feb 2021 10:16 by ADMIN
Created by: Milos
Comments: 0
Category: Chart
Type: Feature Request
0
Provide an option to move (drag and drop) data points in chart control. 
Unplanned
Last Updated: 19 Feb 2021 18:04 by RAMAKANT
Created by: RAMAKANT
Comments: 6
Category: Chart
Type: Bug Report
1

Hi Team,

If you set the PanOffset in XAML, it is not applied. 

Does not work:

<telerikChart:RadCartesianChart x:Name="MyChart"  Zoom="2, 1"  PanOffset="-400,0" >

I would expect that the RadChartView renderer would be responsible for handling this after the control is loaded and the series/axis is rendered (see workaround).

Workaround

If I subscribe to the ChartView's NativeControlLoaded event and wait approx 100ms before calling PanOffset, it will work.

e.g.

<telerikChart:RadCartesianChart x:Name="MyChart"  Zoom="2, 1" 
                                                     NativeControlLoaded="MyChart_OnNativeControlLoaded">

private async void MyChart_OnNativeControlLoaded(object sender, EventArgs e)
{
    await Task.Delay(100);
    
    MyChart.PanOffset = new Point(-400, 0);
}

Takeaway and Action Requested

The takeaway, and basis of this Bug Report, is that the control should internally perform this delay check and set the PanOffset.

This will enable MVVM scenarios because (I originally wanted to bind the PanOffset value from my view model).

Thank you,

Ramakant

Unplanned
Last Updated: 13 Jan 2021 15:12 by ADMIN
In the case of stacked column chart (Chart with BarSeries with Stack CombineMode), and if the data contains negative values, series labels are displayed at the correct position.
Completed
Last Updated: 24 Feb 2021 13:03 by ADMIN
Release R1 2021 SP1

An exception is thrown on Android when this code is executed


            this.chart1.VerticalAxis = new NumericalAxis { Minimum = 300, Maximum = 400 };
            this.chart1.VerticalAxis = new NumericalAxis { Minimum = 100, Maximum = 200 };

Unplanned
Last Updated: 23 Nov 2020 08:58 by ADMIN
Created by: Marwen
Comments: 0
Category: Chart
Type: Feature Request
1
Rework the Series property of the Chart, so it can be consumed in the view model.
Unplanned
Last Updated: 18 May 2020 14:07 by ADMIN
Currently the ticks on the axis are calculated according to the Min and Max values as well as MajorStep in even intervals. We need to provide a way to set different intervals between the ticks.
Unplanned
Last Updated: 04 May 2020 10:38 by ADMIN
When the chart is zoomed/panned and the data is refreshed asynchronously, the app locks up and eventually crashes on iOS with  NSInvalidArgumentException.
Unplanned
Last Updated: 01 Apr 2020 11:33 by ADMIN
when applying custom label formatter to wrap the categorical axis label text, the text is not wrapped. It works fine on iOS and UWP.
Unplanned
Last Updated: 01 Apr 2020 08:47 by ADMIN

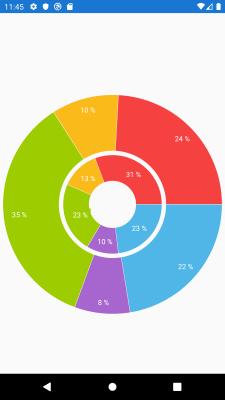
If you have the following PieChart with donut series definition:

<telerikChart:RadPieChart HeightRequest="200" 
                          WidthRequest="200">
    <telerikChart:RadPieChart.Series>
        <telerikChart:DonutSeries ShowLabels="True"
                                  ValueBinding="Value"
                                  ItemsSource="{Binding Data}" />
        <telerikChart:DonutSeries ShowLabels="True"
                                  RadiusFactor="0.45"
                                  ValueBinding="Value"
                                  ItemsSource="{Binding Data1}" />
    </telerikChart:RadPieChart.Series>
</telerikChart:RadPieChart>

On android works as expected:

On iOS the series are overlapped and not visualized as expected. The radius factor is not respected

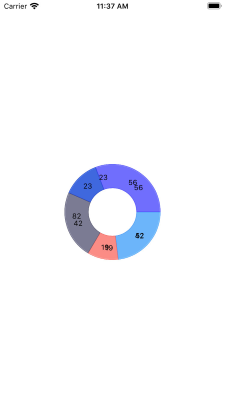
On UWP the second donut series in not visualized and the radius factor is not respected.

Unplanned
Last Updated: 18 Mar 2020 12:55 by ADMIN
Created by: Mayank
Comments: 0
Category: Chart
Type: Feature Request
0
I want to create Drill-down charts in my xamarin.forms application. Please provide this functionality in Telerik UI for Xamarin Chart control. I want to drill-down from any type of chart to any type of chart for e.g Line chart can drill down to bar or pie chart.
Unplanned
Last Updated: 02 Jul 2021 08:26 by ADMIN
The Chart loses all the UI customizations made in the iOS platform renderer when the Series are updated, for example, if you show/hide certain Series or updated their ItemsSource.
Unplanned
Last Updated: 23 Jan 2020 14:20 by ADMIN
Created by: n/a
Comments: 0
Category: Chart
Type: Feature Request
1
Add support for funnel chart
Unplanned
Last Updated: 07 Apr 2021 06:37 by Stefan
Applying ChartTrackBallBehavior to a CartesianChart with ScatterLine/ScatterPoint series does not take any effect.
Completed
Last Updated: 06 Nov 2020 14:51 by ADMIN
Release 2020.3.1106 (R3 2020 minor release)
On the Chart control, the labels of the Legend are in a different font than everywhere else on iOS.
Unplanned
Last Updated: 05 Nov 2019 11:08 by ADMIN
If you clear the collection bound to the series ItemsSource and add new items to it, the changes are not reflected on the Chart