XLSB is binary format that should theoretically allow fast reading and writing to the file.
With the current implementation, the Notes support only a rectangular shape.
Examples:

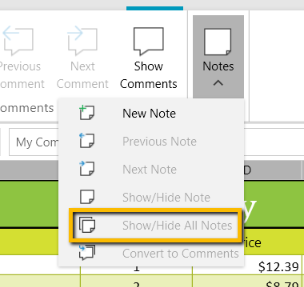
The button should always be active.
The button:
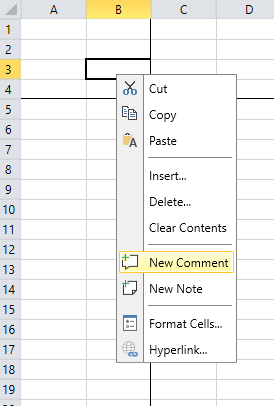
When the Freeze Panes option is enabled and try to insert a new comment into the next cell on the left to the Freeze Panes separator the comment is deleted.
Add support for conditional formatting of cells - allow applying of rules used during visualization of cells to automatically apply formatting depending on their values.
Custom style is not applied to empty cells when applying to the entire row.
Workaround:
Dim usedCellRange As CellRange = mobjValidationResultWs.UsedCellRange
For rowIndex As Integer = usedCellRange.FromIndex.RowIndex To usedCellRange.ToIndex.RowIndex
    For columnIndex As Integer = usedCellRange.FromIndex.ColumnIndex To usedCellRange.ToIndex.ColumnIndex
        Dim cell As CellSelection = mobjValidationResultWs.Cells(rowIndex, columnIndex)
        cell.SetStyleName("Common")

    Next columnIndex
Next rowIndex
Hello,
we have an Excel export in our software that we solved via Telerik Spreadsheet.
An exported Excel Table can also contain images.
These pictures are inserted as shape objects.
The Placement Property is set to xlMove (xlPlacement Enum) in Excel.
If you now filter the data in Excel, the images remain and are not hidden.
We therefore need a way of being able to change this Placement Property to the Value xlMoveAndSize
It would be very desirable if this option were made available in Telerik Spreadsheet as our customers urgently need it.
Hi,
Range name becomes incorrect after removing row in a spreadsheet.
Use case:
- Set range name to 'test' on cell A5
- Remove row 4 (option entire row)
Observed:
- Range name is still located on cell A5
Expected:
- Range name 'test' on cell A4. Similar behavior as in MS Excel
Can be reproduced using the Telerik WPF demo app.
The named ranges are not updated after rows columns are inserted.
This item is migrated to the Telerik Document Processing portal: https://feedback.telerik.com/document-processing/1549293. Please, use the new item for commenting, voting, and subscribing instead of this one.Fill right shortcut (Ctrl + R) does not work
As a workaround, manually register the combination:
public MainWindow()
{
    InitializeComponent();
    this.radSpreadsheet.ActiveSheetChanged += RadSpreadsheet_ActiveSheetChanged;

    this.Loaded += MainWindow_Loaded;
}

private void MainWindow_Loaded(object sender, RoutedEventArgs e)
{
    RegisterFillRight();
}

private void RadSpreadsheet_ActiveSheetChanged(object sender, EventArgs e)
{
    RegisterFillRight();
}
public void RegisterFillRight()
{
    RadWorksheetEditor worksheetEditor = this.radSpreadsheet.ActiveWorksheetEditor;

    if (this.radSpreadsheet.ActiveWorksheetEditor != null)
    {
        worksheetEditor.KeyBindings.RegisterCommand(worksheetEditor.Commands.FillRight, Key.R, ModifierKeys.Control);
    }
}
The formula is not evaluated correctly when the fill right function is used.
To reproduce:
1. Enter the word "A1" in cell A1 and "B1" in cell B1.
2. Enter the formula "=A1&B1" in cell C1. C1 now correctly shows "A1B1"
3. Select C1 to H1 and run the Fill Right command.
Observe that D1, E1, and F1 show the correct result, but G1 and H1 show "0".
Workaround:
Save and reopen the document.