We'd like to have a settable property on the web designer and report viewer which takes a function which returns an access token.
This way a new access token can be requested by the designer/viewer when the current one expires.
This is usually used in the following way:
- Implement a function with signature "string GetAccessToken()"
- Set that function to the property AccessTokenProvider of the designer/viewer
- Designer/Viewer wants to make a request and fetches and caches the access token
- Designer/Viewer uses that access token until it hits a 401 upon which
- The Cached access token is cleared
- A new Access token is fetched from AccessTokenProvider and then cached
- Retry the request with the new access token
- Should the retry also fail return the failure
Should the above be to specific/inflexible:
Instead of caching the access token, call AccessTokenProvider for every fetch but also provide an additional parameter with the "reason" for the call, so the implementer of AccessTokenProvider can decide themselves when to return a cached AccessToken or generate a new one.
Greetings,
Telerik.Reporting version: 19.1.25.521
ASP.NET Web Forms
Our team recently had a some trouble understanding the behavior of the ReportViewer.ParametersArea and the property "ParametersAreaVisible". Our desire was to hide this to the end user because the ParametersArea should not be fiddled with directly by the our end users; sensitive data could be accessed. Setting this to false does not stop the render of the ParametersArea. Typically setting the property on a control in ASP.NET Web Forms means the control will not render to the page. So having a property named "ParametersAreaVisible" is misleading in my opinion. I know the ParametersArea is thought as a benefit to the end user but in our case we do not desire this.
My feature request is to add a new property "DisableParameterArea" to the ReportViewer that causes the ParametersArea to not render to the ReportViewer.
Thank you
Hi Telerik team
I'd like to implement customer specific colors based on a report variable or database field.
Currently it looks like the color properties only give us a color picker but does not support using an expression, is this correct?
As for context, I do not know the color in advance and it is used at 100+ different objects.
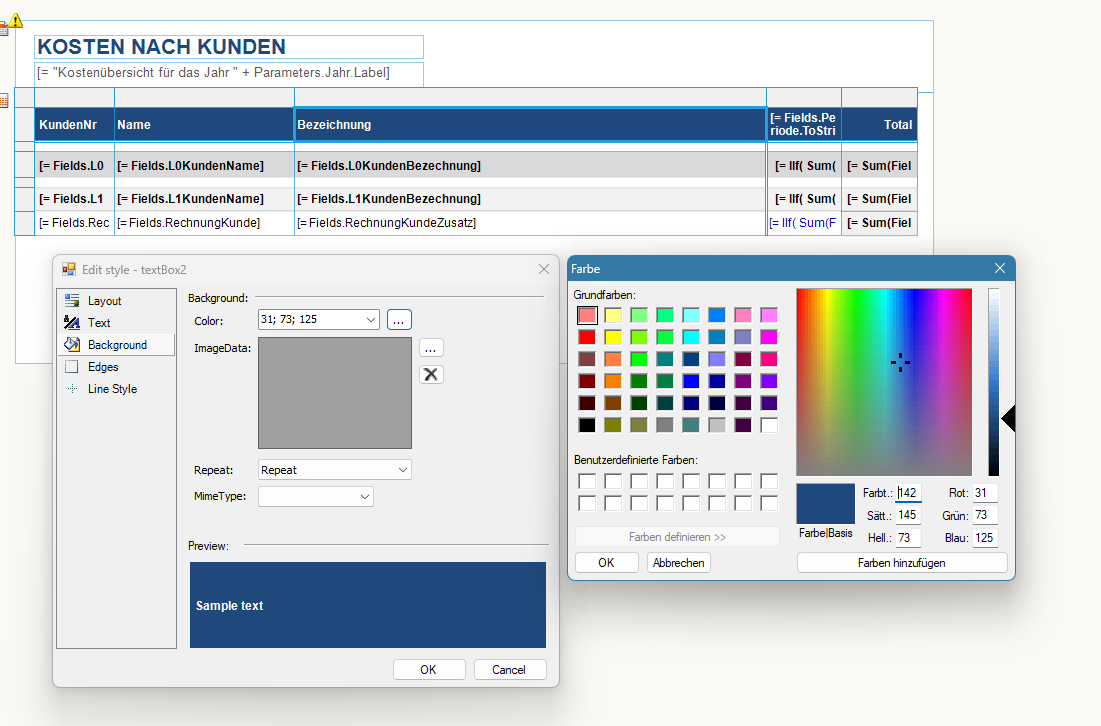
Same problem with conditional formats
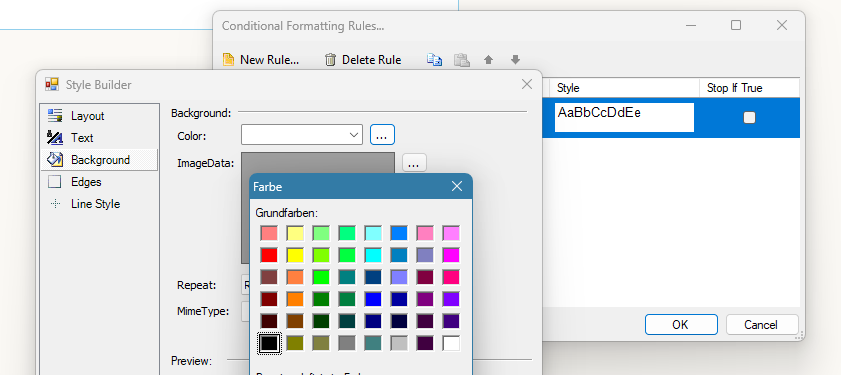
Please let me know how to choose colors based on expressions.
If this is not possible yet, I'd like to request it as a new featur.
Best regards,
At the moment it's only possible to have your reports in old-fashioned projects.
It should be possible to add/design reports to SDK-style projects. That should work no matter what target framework is (.NET Core, .NET Standard or .NET Framework).
Having the ability to be able to set properties of the HTML5 report viewer globally would be a nice addition. This functionality already exists for other controls and it would have saved me lots of work when I needed to set a template url to over 50 pages.
Hopefully this gets implemented and saves someone else some of their time and if so, your welcome :)
Add the ability to specify rounded corners for the border of TextBoxes, Pictures, Tables and all other similar controls.
Currently, when you set SplitWorksheetOnPageBreak to True, the Excel Sheet name is formed from the DocumentName or ReportName and the number of the page.
It would be very helpful if the report authors can manipulate these names with Expressions.
If you embed an iframe that points to a report viewer on a page, and the page is hosted on a web server on a different origin, the print functionality does not work.
Consider implementing a workaround to enable it.
In the Telerik Reporting Designer there are already quite a few Chart Diagrams included but the one that is missing is a Sankey Diagram. This is already integrated in the Charts in KendoReact for example and I would like to request to also add this in Telerik Reporting because I think it would be a great addition and also we would for sure need this.
Thanks,
Regards,
Bernd
Our clients enter information using the radeditor and in many cases want to embedded tables and graphics into their text. Using your reporting tool there is no way to print this information. I know you have suggested using your table and image tools, but that doesn't work when you are dealing with freely formatted text so the existance and location of the tables and images cannot be predicted.
When I drag a data field from a DataSource component to the Report details section in the Standalone Report Designer, the Report > DataSource property is set automatically to the corresponding DataSource component.
In the Web Report Designer, when I drag a data field, the Report > DataSource property remains empty, and the Preview shows an empty report. It would be very helpful the same functionality to be introduced also in the Web Designer.
<dependencies>
  <group targetFramework=".NETFramework4.6.2">
    <dependency id="Newtonsoft.Json" version="13.0.1" />
    <dependency id="Telerik.Reporting" version="[19.0.25.313]" />
    <dependency id="Microsoft.Net.Http" version="2.2.29" />
  </group>
  <group targetFramework=".NETStandard2.0">
    <dependency id="Newtonsoft.Json" version="13.0.1" />
    <dependency id="Telerik.Reporting" version="[19.0.25.313]" />
  </group>
</dependencies>
The package "Microsoft.Net.Http" is with the latest available version and depends on:
Microsoft.Bcl (>= 1.1.10)
Microsoft.Bcl.Build (>= 1.0.14)
The package "Microsoft.Bcl" is indeed deprecated.
I often need to have the same Report Parameters in different reports, including the main and its subreport. Currently, I need to add the parameters manually.
It would be very useful if we could copy/paste Report Parameters between reports.
I just recently updated to the latest reporting release 2025 Q1 in addition to updating to the newest Visual Studio Community 2022 (64-bit) - Current
Version 17.13.2
I installed the newest reporting update and updated my VS project.
I must have at least 50 different reports which I have previously designed and have been working fine. The DataSource is set to the object exposing all the key fields using gets. Works fine when running the program but after all the updates, all of a sudden I can see, in the designer, the fields in the fields list when editing an element value reference or in the the Data Explorer.
Played with a sample element in the detail panel. The form has the data source set correctly. The toolbox also shows the reporting tools. No go.
I verified the new reporting DLL is intact.
Same situation with all my reports. All work fine running, just the designer interface is not working.
I even tried on another computer, also updated, and experienced the same problem.
Again, now all my reports don't show the list - something intrinsically has changed. with the setup and recognition of the DS.
Eric
I have projects on .NET Core and I want to use the System.Text.Json serializer that is the new default, but reporting relies on Newtonsoft.Json.
---
ADMIN EDIT
There are two approaches that can be taken right now to solve this:
OPTION 1: define separate endpoints (services, projects) for the different tasks - they can still use the same database layer through a shared project, depending on the architecture you have. This would let you have separated services with the appropriate serializers without custom attributes and code (see below). For example, create a separate project for the reporting REST services.
OPTION 2: add some custom decoration on the endpoints so you can choose which serializer is used on each, you can find some examples here: https://stackoverflow.com/questions/59650907/how-to-configure-two-json-serializers-and-select-the-correct-one-based-on-the-ro - the point being to register a serializer depending on the endpoint based on your own code rather than let the framework put one in for all endpoints.
NOTE: This would be a breaking change.
---
There is currently an option for GroupKeepTogether of FirstDetail for the Group, which keeps the Group Header with the first line of the Detail section.
This option needs to be duplicated for the Group Header and the Group Footer.
The Group Footer would contain an option to keep with first detail and the Group Footer would have an option to keep with last detail.
We have reports rendered through the Native Blazor Report Viewer.
Consider adding a file attachment option in the Send Email dialog for report viewers.