

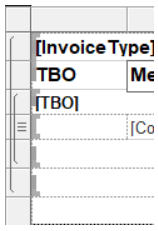
Coming from having developed many SSRS reports one thing I think telerik is missing is a nicer visualisation of row and column grouping in a table. SSRS does this really well as shown in the screenshot below where we can easily see which rows belong to the detail and 2 other groups.
I think this would be a very useful addition to the telerik designers!
If I put the following content in an HtmlTextBox, when I open the preview mode of the designer or look at it in the Html5 Report Viewer I get annoying extra gaps:
<p>Comment</p><p>Comment</p><ol><li>List</li><li>List</li><li>List</li></ol><p><br></p><p>Comment</p><p>Comment</p>I tried to replace these <p>-tags with <div>-tags:
<div>Comment</div><div>Comment</div><ol><li>List</li><li>List</li><li>List</li></ol><div><br></div><div>Comment</div><div>Comment</div>It helps. But there are some other tags that cannot be replaced (tags of ordered and unordered lists for example). And these gaps are still rendered.
We would like have two options when we use the date time parameter in report.
one is only date, other one is date and time. and we need to provide the format to the date time parameter for internationalization.
As our business requirements are very strict we need to be able to set the Graph Scale Maximum and Minimum properties based on our data. This would make our charts much more visually pleasing having the needed empty space above the data.

For example, the most often required scenario is setting the Scale.Maximum as a percentage of the already calculated max value by the Telerik Reporting engine.

We imagine there would be some kind of object which we can use inside an expression in these properties: = CalculatedMaxValue * (1 + 0.1)
Or we can calculate the value ourselves inside a User Function and then use the function in the expression.

I'd like to suggest that the behaviour (positions the viewer at the top) used for alternating between the bookmarks to the Report Header and Group Header using the document map, be applied to the Page Header too. It would be better, if the viewer always started at the top of the first page when using the Page Header.

Bug Report ID: 902125 -- Scroll Top when alternating between bookmarks

About the attachments:
-OriginalReports - these files show the reports without clicking on the bookmarks
-ReportScrollTopBetweenBookmarks - these files show the reports after clicking on the bookmarks

Allow custom buttons and other controls to be added to the existing ReportViewer Control Toolbar.
I need to customize the standalone Report Designer. I distribute it with my own product and I need to replace the title of the standalone ReportDesigner with my brand.
For example DevExpress report designer allows that.
When using multiple Condition Formatting Rules, the only option is the AND. An OR option should also be available.

Ability to localize Standalone Report Designer created reports without the need of using custom functions.
I need SVG background images which are rendered as vectors to PDF (not rasterized) - just like with PictureBoxes.
When designing reports with lots of parameters (which is very common for my usage), I often get error message "Missing or invalid parameter value" or "Syntax error in expression". I find it very time consuming and annoying to manually check "all" parameters in order to identify which one is causing the issue.

Would it be possible to include more details in these error messages, e.g. by including the name of the (first) incorrect parameter? Preferably for the message in report viewer / preview, but at least in the log file.
https://www.telerik.com/forums/missing-or-invalid-parameter-value-please-input-valid-data-for-all-parameters

Please provide the possibility to localize the HTML5 Report Viewer UI in a way that doesn't require modifying the template.

It's already possible to localize the messages shown by the HTML5 Report Viewer as shown here: http://www.telerik.com/help/reporting/html5-report-viewer-localization.html
Something similar for the actual UI would be great.
For Clustered Column graph should be some feature allowing to mark zones, something like marked zones.
Currently If you want to hide one filter out of many based on other value. this is feature is not available in report now. below the my ticket for you same. I wish this feature include out of the box.

https://www.telerik.com/account/support-tickets/view-ticket?threadid=1102630

Much like the way Excel has the ability to utilize VBA functions. it would be usefull and more conventient for developer if they could include custom functionality/functions in a report rather than use an external assembly. The steps involved to include/use an external assembly is daunting at best and not at all straight forward.
Something like you right click the report and one of the menu options is "Add Custom Function". Or in the expressions dialog box have an option to create/add a custom function.
You get the point. I'm sure your team of developers could come up with something.
