Can I customize the text inside the bar?
- Text Color, Position, FontSize, etc.
Minor ticks are available for Telerik WPF chart: https://docs.telerik.com/devtools/wpf/controls/radchartview/features/minor-ticks-and-stripes
Provide a way to invoke the tooltip for a concrete data point programmatically
Currently to achieve this I have to access the native chart and apply a gradient on the native chart series fill and stroke on iOS/Mac
on WinUI I have to define a new template for the series PointTemplate. and set the color.
when having a chart with horizontal datetime axis and trackball behavior, the first and last points are not displayed in the trackball
when using categorical axis, the last point displays in the tooltip, but the first point does not.
I just made a little test application using the .NET 6 Preview 6 and MAUI with chart control to see if we can use it for a future project. I was able to display just a basic chart with 1000 points in it, in ascending order on X axis. But the performance is really not there when running on my Android 10 device. I only made a Zoom at factor 2 and use panning right to left and it's not smooth at all. There is nothing in the chart (no grid, no annotations). Just a simple 2 axis chart. I can really not go with this because there will be many more data in our product at the chart need to be fast enough. Maybe it's a settings somewhere that need to be adjusted... Take a note that I was able to run the chart in WinUI project and the performance is correct, but I am on a very fast PC, it is just normal to be fast. Note: There is some kind of deceleration effect when panning, I want to disable it but not found how.
Anyway, it will be really cool if you can provide a very simple MAUI test application with the fastest full screen chart with Pan/Zoom with 1000 points (which for me is really not much data) and the corresponding code to me to validate if your library can do the job. I know that MAUI and .NET 6 is not released yet, but performance should be there now because it's really close to bug fixing only state now. Thanks.
Hi Team,
Currently on Android, the Chart renderers do not setup the XValueBinding and YValueBinding correctly if the property name is a nested property. This results in an UnhandledException at runtime
You can reproduce the issue using .NET MAUI RC2 and Telerik UI for MAUI 0.8.0, with the following implementation:
- Create a File > New .NET MAUI RC2 project (VS 2022 Preview 5)
- Setup MainPage using the following code
XAML
<?xml version="1.0" encoding="utf-8" ?>
<ContentPage xmlns="http://schemas.microsoft.com/dotnet/2021/maui"
             xmlns:x="http://schemas.microsoft.com/winfx/2009/xaml"
             xmlns:telerikChart="clr-namespace:Telerik.XamarinForms.Chart;assembly=Telerik.Maui.Controls.Compatibility"
             x:Class="MauiApp1.MainPage">

    <telerikChart:RadCartesianChart MinimumHeightRequest="300">
        <telerikChart:RadCartesianChart.HorizontalAxis>
            <telerikChart:NumericalAxis LabelFitMode="MultiLine" />
        </telerikChart:RadCartesianChart.HorizontalAxis>
        <telerikChart:RadCartesianChart.VerticalAxis>
            <telerikChart:NumericalAxis />
        </telerikChart:RadCartesianChart.VerticalAxis>

        <telerikChart:RadCartesianChart.Series>
            <telerikChart:ScatterSplineSeries XValueBinding="NumericalData.XData" YValueBinding="NumericalData.YData" ItemsSource="{Binding Data1}" />
        </telerikChart:RadCartesianChart.Series>
    </telerikChart:RadCartesianChart>
</ContentPage>
Code-behind
namespace MauiApp1;

using System.Collections.ObjectModel;

public partial class MainPage : ContentPage
{
    public MainPage()
    {
        InitializeComponent();
        Data1 = GetNumericData1();
        BindingContext = this;
    }

    public ObservableCollection<Item> Data1 { get; set; }

    public static ObservableCollection<Item> GetNumericData1()
    {
        var data = new ObservableCollection<Item>
        {
            new Item { NumericalData = new NumericalData { XData = 2, YData = 13 } },
            new Item { NumericalData = new NumericalData { XData = 19, YData = 31 } },
            new Item { NumericalData = new NumericalData { XData = 22, YData = 33 } },
            new Item { NumericalData = new NumericalData { XData = 28, YData = 35 } },
            new Item { NumericalData = new NumericalData { XData = 33, YData = 46 } },
            new Item { NumericalData = new NumericalData { XData = 38, YData = 34 } },
            new Item { NumericalData = new NumericalData { XData = 49, YData = 66 } },
            new Item { NumericalData = new NumericalData { XData = 55, YData = 24 } },
            new Item { NumericalData = new NumericalData { XData = 62, YData = 41 } },
        };
        return data;
    }
}

public class NumericalData
{
    public double XData { get; set; }
    public double YData { get; set; }
}

public class Item
{
    public NumericalData NumericalData { get; set; }
}
Thank you!
Martin
I would like to use line style instead of colour to distinguish between the different series on my chart as below.

Is this possible?
From the docs it looks like we can only customise stroke colour and thickness.
Thanks =)
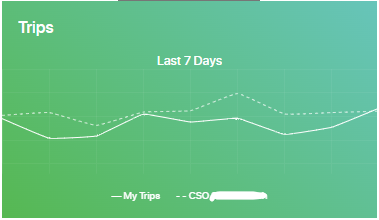
Can the Legend be identical to the LineSeries, not only by colour, but also by style?