Bug report
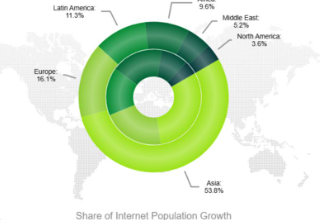
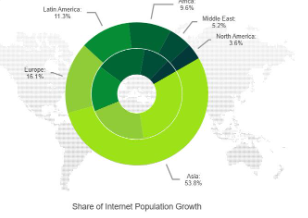
Donut Chart Overlay looks different after Q2 2024
Before Q2 2024
After Q2 2024
Reproduction of the problem
Dojo demo: https://dojo.telerik.com/GHWBFuzv
Environment
Kendo UI version: 2024.2.514 or newer
Browser: [all]
Hello,
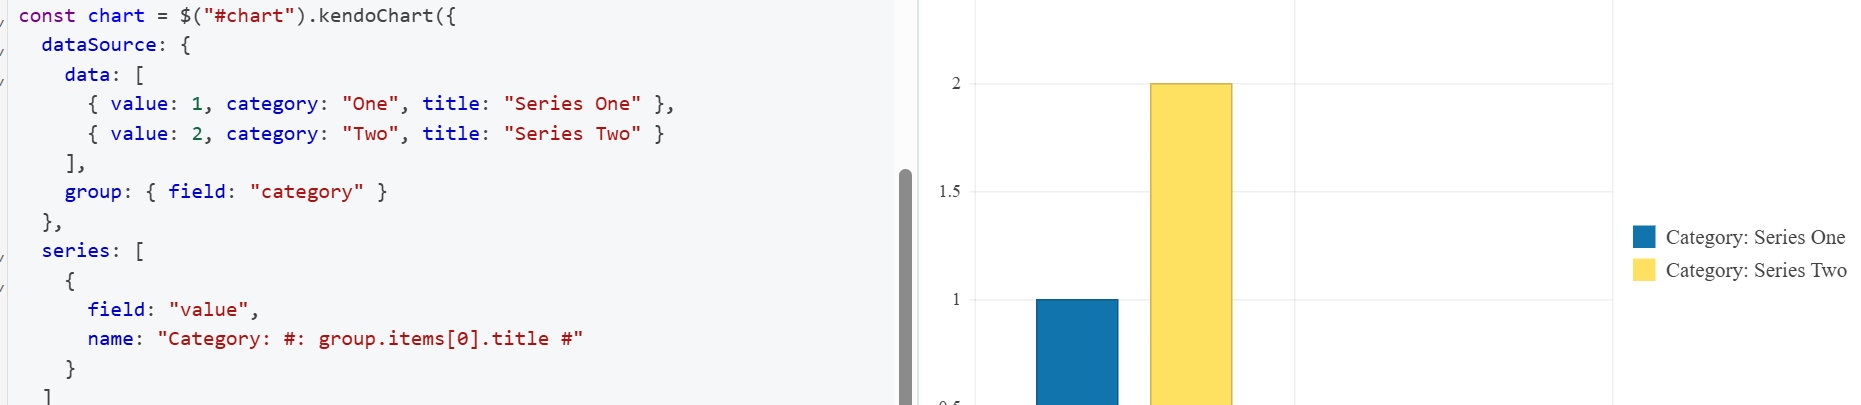
I noticed in some of my charts that when I call saveAsPDF, the series.name seems to be just a literal string of the series.name option, even when I use a template.
Please see the attached dojo to reproduce (I based this dojo off of the Chart API series.name as template dojo example).
https://dojo.telerik.com/ZgsUVIjM
I noticed that this behavior starts in 2024.4.1112. Prior versions evaluated the template for the PDF.
I do have a workaround for this, which is included in comments in my dojo. I just exportPDF and then use kendo.saveAs.
Additionally, I noticed that the bars in the chart are at 0 in the PDF. I'm not worrying about that at this time, I'm exclusively interested in the series.name template being evaluated on saveAsPDF.
Here are some screenshots of the dojo and resulting pdf for v2024.4.1112:
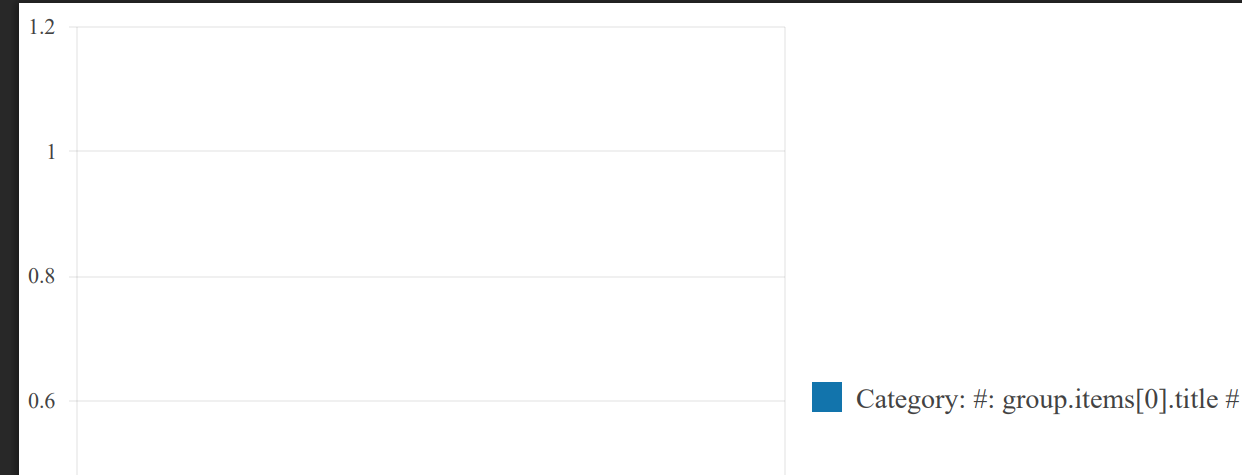
Here is a screenshot of the pdf when the same dojo is run on 2024.3.1015:
Please let me know if you'd rather I paste the dojo code directly into this ticket, or attach as a code file.
Thanks!
-Alexa
Bug report
Pie and Donut Chart can not be exported to PDF, Png or Jpg
Reproduction of the problem
- Open the demos - https://demos.telerik.com/kendo-ui/pdf-export/index or the Dojo - https://dojo.telerik.com/LfDhdqXf
- Try to export the Chart in any format
Current behavior
The pie and donut charts are missing.
Expected/desired behavior
The Charts should be exported to the selected file format
The issue is a regression starting with 2024.4.1112
Environment
- Kendo UI version: 2024.4.1112
- Browser: [all]
Pie chart labels are not properly rendered when exported to image.
The issue can be reproduced here:
Bug report
Drawing API Tooltip for categoryAxis Chart labels do not show with v.2024.4.1112
Reproduction of the problem
https://docs.telerik.com/kendo-ui/knowledge-base/tooltip-for-category-axis-labels
Expected/desired behavior
The Charts should be exported to the selected file format
The issue is a regression starting with 2024.4.1112
Environment
jQuery: 3.4.1
Kendo UI version: 2024.4.1112
Browser: [all]
Bug Report
The diagram.exportImage() throws an error with v.2024.4.1112
"Uncaught TypeError: diagram.exportImage(...).done is not a function"
Regression with 2024.4.1112.
Reproduction of the problem
Run the example from the following API: https://docs.telerik.com/kendo-ui/api/javascript/dataviz/ui/diagram/methods/exportimage
Current behavior
The export is not working.
Expected behavior
No error shall be present and image must be generated.
Environment
Kendo UI version: 2024.4.1112
jQuery version: x.y
Browser: [all]
Description: When 'shared' tooltip is enabled (tooltip: {shared: true}) keyboard navigation through chart triggers JavaScript error and tooltip on focus is not shown, neither shared nor regular tooltip. It works without issues when 'shared' is disabled, but when it is enabled errors are triggered.
Steps to reproduce:
- Open Dojo example https://dojo.telerik.com/@oleksii.shumakov@thomsonreuters.com/UqixUyuj
- Open browser's console (F12)
- Run the script
- With mouse click on "India" legend item once -> India line is disabled
- Click on "India" legend item once more -> India line is enabled
- Using keyboard hit Shift+Tab -> Browser's console shows error: "Uncaught TypeError: Cannot read properties of undefined (reading 'format')"
- Using keyboard hit Tab -> Dot on chart line becomes highlighted but no tooltip is shown
Stack trace of the issue:
kendo.all.js:290271 Uncaught TypeError: Cannot read properties of undefined (reading 'format')
    at init.show (kendo.all.js:290271:1)
    at init._displayTooltip (kendo.all.js:302830:1)
    at init._focusFirstPoint (kendo.all.js:302653:1)
    at init._navigatePoints (kendo.all.js:302577:1)
    at init._keydown (kendo.all.js:302540:1)
show @ kendo.all.js:290271
_displayTooltip @ kendo.all.js:302830
_focusFirstPoint @ kendo.all.js:302653
_navigatePoints @ kendo.all.js:302577
_keydown @ kendo.all.js:302540
Versions of KendoUI with the issue: 2024.2.514, 2024.3.806
Chart Series provide a toggleVisibility() method that allows to hide some data points of the series (or all of them) from the user. However, setting the first series to invisible breaks the chart's keyboard navigation.
This DOJO demonstrates the behavior: For the sake of simplicity, the first of the two series is toggled invisible right after the chart is rendered, but this may happen at any other point in time. Click anywhere in the DOJO's output area. Press TAB to focus the chart. The following error is logged in the browser console:
Uncaught TypeError: Cannot read properties of undefined (reading 'options')
    at init.focusVisual (kendo.all.min.js:9:4230266)
    at init._focusElement (kendo.all.min.js:9:4410242)
    at init._focusFirstPoint (kendo.all.min.js:9:4409100)
    at init._focus (kendo.all.min.js:9:4407358)
Dear support team,
we are facing an issue when trying to use "setOptions" to update a Chart.
It works fine when using a normal bar chart but seems to be broken when using stacked bars:
https://dojo.telerik.com/AKEWaLIR
Are we doing something wrong or is this a bug?
Bug report
The stack bar chart is not rendered as expected when stack.type is set
Reproduction of the problem
- Open d the Demos - https://demos.telerik.com/kendo-ui/bar-charts/stacked100-bar or the API
- https://docs.telerik.com/kendo-ui/api/javascript/dataviz/ui/chart/configuration/series.stack#seriesstacktype
- https://docs.telerik.com/kendo-ui/api/javascript/dataviz/ui/chart/configuration/seriesdefaults.stack.type
Current behavior
The Chart is not rendered correctly, the bars are misaligned.
Expected/desired behavior
The bars should be aligned.
Regression: The issue is reproducible starting with 2024.1.130 version
Environment
- Kendo UI version: 2024.1.130
- Browser: [all ]
Bug Report
When the zIndex is set the the chart marker in the legend is misaligned.
Reproduction of the problem
- Open the Dojo - https://dojo.telerik.com/@NeliK/OCEtoRuz
Current behavior
The line and the marker in the legend are misaligned.

Expected/desired behavior
The line and the marker should be aligned even when the zindex is set.

Environment
- Kendo UI version: 2024.1.319
- Browser: [all ]
In case you are using a chart with the following configuration:
$("#chart").kendoChart({
  series: [{
    type: "radarLine",
    missingValues: "gap",
    data: [1, null, null, null, 5]
  }]
});
There is no line between the last and the first data point of the series.
But when the 2nd and 4th data points are set as well, this connection is added:
$("#chart").kendoChart({
  series: [{
    type: "radarLine",
    missingValues: "gap",
    data: [1, 3, null, 3, 5]
  }]
});
Expected behaviour: As the chart displays a "circle", all data points next to each other should be connected in case they are having a value.
The same issue can be seen in this DOJO, where the fifth data point is not connected to the rest of the points. This only happens if "missingValues" is set to "gap".
Bug report
Setting the visibility using the toggleVisibility method in the legendItemHover event leads to legendItemHover being triggered multiple times. Thus, the legendItemLeave method is never called.
Reproduction of the problem
- Open the Dojo example - https://dojo.telerik.com/@NeliKondova/UVIVaBoH
- Hover the legend
Current behavior
If you try to move the cursor slightly the legendItemHover event is fired multiple times and the legendItemLeave event is never called.
Expected/desired behavior
The legendItemHover should be fired a single time when the mouse enters the legend and also the legendItemLeave should be fired even if the visibility of the legend is set through the toggleVisibility method.
Workaround - Check for visible/not visible series in the series._options
function onLegendItemHover(e){
        e.preventDefault();
        console.log("Hover");
        let chart = e.sender;
        let seriesIndex = e.seriesIndex;

        for(let i = 0; i < chart.options.series.length; i++){
          if(i !== seriesIndex){
            let series = chart.findSeriesByIndex(i);
            if (series._options.visible) {
	            chart.findSeriesByIndex(i).toggleVisibility(false);
            }
          }
        }
      }

      function onLegendItemLeave(e){
        e.preventDefault();
        let chart = e.sender;
        console.log("Leave");
        for(let i = 0; i < chart.options.series.length; i++){
          let series = chart.findSeriesByIndex(i);
          if (!series._options.visible) {
            chart.findSeriesByIndex(i).toggleVisibility(true);
          }
        }
      }
Dojo with workaround - https://dojo.telerik.com/@NeliKondova/EpOYadid
Environment
- Kendo UI version: 2023.3.1114
- Browser: [all ]
I need that the point will be in the start of chart (like justified property behavior) and the line style of "rangeArea" type property will be "step".
In this example the point in the start and the justified property works as expected.
https://dojo.telerik.com/IZuXOyAZ
but in the second example, when I added property: line: {style: "step"} to "rangeArea" type, the point start in the middle of labels, and justified property not working.
https://dojo.telerik.com/ILOxehAB/3
So I need that my chart will be like the second example, but the start point of the line will be like the first example.
Bug report
Chart with log valueAxis allows to deem zoom and throws an error: Uncaught Error: Non positive values cannot be used for a logarithmic axis
Reproduction of the problem
Dojo: https://dojo.telerik.com/OCuziYOr
Expected/desired behavior
The Chart shall not allow this deep zoom
Environment
Kendo UI version:[all]
Browser: [all ]
Bug report
When the user tries to zoom the Chart and a zero range is selected, an error (Uncaught TypeError: Cannot read properties of undefined (reading 'min')) is thrown in the browsers console.
Reproduction of the problem
- Open the Dojo - https://dojo.telerik.com/@NeliKondova/eQiKUqOB
- Press the
Shiftkey and select a range. Try the min and max of the range to be almost the same.
Current behavior
Uncaught TypeError: Cannot read properties of undefined (reading 'min') error is thrown in the console.
screencast - https://somup.com/c06lloBaw2
Expected/desired behavior
There should be no error in the browsers console, no matter of the selected range.
Environment
- Kendo UI version: 2023.3.1010
- Browser: [all ]
The problem can be seen in the following Dojo:
https://dojo.telerik.com/uQeduJAG
When the Donut Chart has a section with value = 0, the color of that point is displayed inside the donut.
We are using asp mvc, but the but it is completely reproduceable with only jquery as shown in the file attached.
When using a scatter chart with a date axis any zooming with the mouse wheel will crash most if not all browsers.
At the very least current versions of chrome (97.0.4692.99), firefox (96.0.1) and edge (97.0.1072.62).
Bug report
ValueAxis.labels.template function invokes twice when Chart is bound to data source
Reproduction of the problem
Check the following Dojo: https://dojo.telerik.com/oJUGixUy/4
Inspect the console
Expected/desired behavior
ValueAxis labels template function shall invoke just one time.
Corner case:
If ValueAxis.labels.font is specified template function is invoked correctly only once.
valueAxis: {
                labels: {
                  // With the font commented out, chart labels get resolved twice
                  font: '11px Arial, Helvetica, sans-serif',
                  template: shortLabels
                }
              },
Environment
**Kendo UI version: [all]
**jQuery version: [all]
**Browser: [all]