Bug report
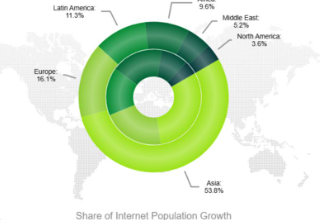
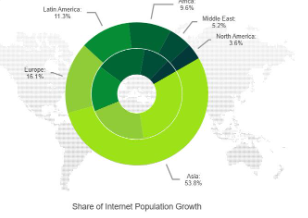
Donut Chart Overlay looks different after Q2 2024
Before Q2 2024
After Q2 2024
Reproduction of the problem
Dojo demo: https://dojo.telerik.com/GHWBFuzv
Environment
Kendo UI version: 2024.2.514 or newer
Browser: [all]
Dear support team,
we are facing an issue when trying to use "setOptions" to update a Chart.
It works fine when using a normal bar chart but seems to be broken when using stacked bars:
https://dojo.telerik.com/AKEWaLIR
Are we doing something wrong or is this a bug?
Hi,
When creating a stacked bar chart in KendoUI 2020.3.915 I noticed the following rendering error:
In case one of the categories is much higher than the other, the x-axis will start at a value other than zero.
This behavior might be desired to zoom in on the exact values.
The issue here is that the steps on the x-axis might repeat multiple times for the same x-value.
(96%, 96%, 97%, 97%, 98%, 98%...)
This increases with a bigger difference between the chart values.
I created a example and it happens even in the latest version:
https://dojo.telerik.com/AVeVuZig
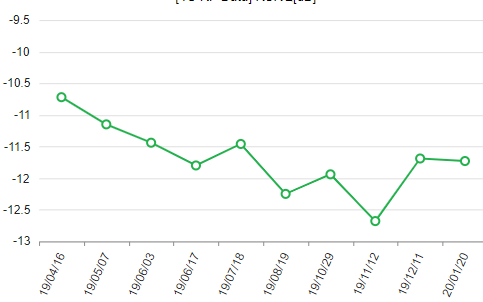
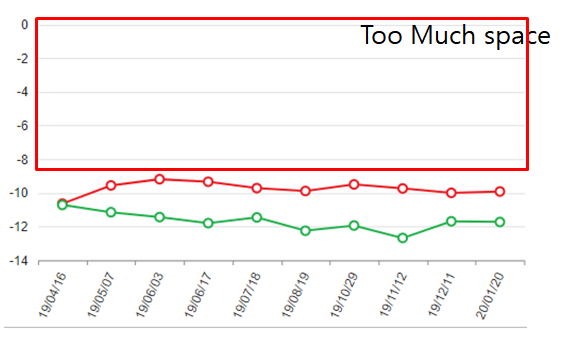
When the data values are all negative, if you create a line graph using kendo chart function, Autoscale on the Y axis is not applied properly. Please check if there is any possible solution.
The two attached figures are normally auto scaled, but the charts that combine the two graphs are not auotoscale normal.
Chart1
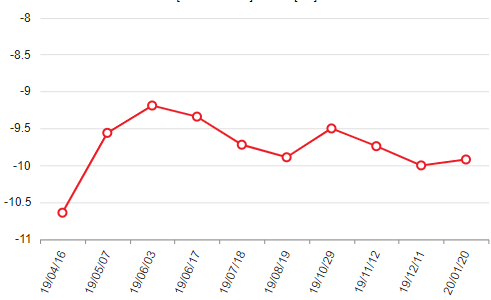
Chart2
issue chart
the dashed line in the chart is showing correctly in IE 10, but when exporting to a png image with the function exportImage, the dashed line becomes a solid line. I've been told that this can be solved with kind of polyfilling, you guys should really make this work, the reason is that this works in Chrome, for the sake of your product consistency, this feature should also work in IE.

if there is a possibility to fix an issue, I think we'd better make it.

Regards

Z. Wang