I have custom messages for my filter, these values replace the and/or values instead of just the visual after switching the and/or once.
Reproducer: https://dojo.telerik.com/AdOGEQey
When initially running you will see "en/of" (and/or), if you than press any of them the text below will insert the message value of the button rather than the underlaying value of "and/or".
Hi,
We have recently upgraded our Kendo MVC version to 2024.2.514.462. The normal upgrade works fine but I was trying to implement the `CSP template` after removing the `unsafe-eval` from the tag as it was announced in 2023 version.
I was following the example given in CSP template and tried changing the template defined in treeview (also as shown in the documentation):-
  sideNavList.kendoTreeView({
      /*template: "<span id='#= item.id #' class='navText'> #= item.text# </span>",*/
      template: ({ items }) => `<span id='kendo.htmlEncode(items.id)' class='navText'> kendo.htmlEncode(items.text) </span>`,
      dataSource: hierarchicalLeftNavData,
It is not throwing error but it's not able to recognize the `item` and rendering the template as:-
<span id="kendo.htmlEncode(items.id)" class="navText"> kendo.htmlEncode(items.text) </span>Am I missing anything?
I have been investigating an issue with the ComboBox component under Chrome whereby a scrollbar is being show when using the autoWidth option and a limited number of list entries.
The scenario is as follows
- When the control initially loads and you hit the dropdown button the list does not have vertical scrollbar.
(See screen shot 1)
- Select an item and and then hit the clear button.
Now when you hit the dropdown the list has a vertical scrollbar.
(See screen shot 2)
The issue is very random and can occur with any number of list items, providing the initial dropdown doesn't require a scrollbar.
I have tried to create a dojo to illustrate the problem but have so far failed.
Looking at the element with Dev tools I see on the initial dropdown the wrapper div is as follows
<div class="k-list-content k-list-scroller" unselectable="on" style="overflow: hidden auto;">
but after select, clear & dropdown the div shows
<div class="k-list-content k-list-scroller" unselectable="on" style="overflow: hidden scroll;">
Tracing through the code the problem is within the following function of the kendo.list.js file
_refreshScroll: function() {
var listView = this.listView;
var enableYScroll = listView.element.height() > listView.content.height();
if (this.options.autoWidth) {
listView.content.css({
overflowX: "hidden",
overflowY: enableYScroll ? "scroll" : "auto"
});
}
},
It would appear that under certain conditions Chrome is setting the enableYScroll value to true and hence the 'scroll'.
Looking at this function I cannot see a reason why there is even a need to set overflowY to 'scroll' surely just leaving it set as 'auto' is good enough and let the browser decided if scrollbars are required.
Regards
Alan
There is an issue with the .k-sorted class being applied to the last column in the grid when the actual column is not visible. It also is not updating the k-sorted when a sort is applied after the grid was created.
This seems to be an issue in the latest release if the column sorted on is hidden, the last column in the grid gets the class. I also noticed that sorting a column does not apply the k-sorted class to the correct column: https://dojo.telerik.com/@dojolee/eFIbaSUn
treelist
- has filterable mode 'row',
- some columns are not filterable,
- columns reordering is allowed
drag-n-drop of columns raises error in console
demo: https://dojo.telerik.com/aFIkOPUp
try to move column "position" left or right
i've tried to apply autoFitColumn method for treelist accordingly to the documentation, https://docs.telerik.com/kendo-ui/api/javascript/ui/treelist/methods/autofitcolumn#autofitcolumn , and seems it assumes only "simple" columns structure, i.e. no nested headers.
Bug report
TreeList with multi-column headers and row filtering throws an error when user tries to reorder a column.
Reproduction of the problem
Open the Dojo - https://dojo.telerik.com/aFIkOPUp/3
Try to move column "position" left or right
Current behavior
Error is thrown
Uncaught TypeError: Cannot read properties of undefined (reading 'locked')
Expected/desired behavior
Rerdering shall be allowed
Environment
jQuery version: 3.4.1
Kendo UI version: [all]
Browser: [all ]
See https://demos.telerik.com/kendo-ui/menu/scrollable
When you hover over the left or right arrow on the menu, the menu scrolls.
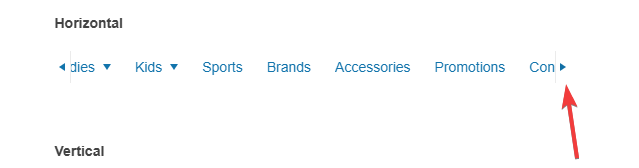
Our client *hates* that, and only wants the menu to scroll when you actually click on the left/right arrow.
Request:
Add an option so that we can turn OFF the scrolling on hover on the left/right scroll buttons in the menu.
Support ticket related: https://www.telerik.com/account/support-center/view-ticket/1662811
In the jquery scrollView component https://docs.telerik.com/kendo-ui/api/javascript/ui/scrollview there is no current way to enableto 'endless' or 'wrap around' option like the react component has
ref: https://www.telerik.com/kendo-react-ui/components/scrollview/endless-scrolling/
Requesting that this feature be added.
For my SPECIFIC my use case (which will probably not work for everyone), I did add a workaround for now
(not fond of it as it relies on the implementation details of the current version)
In our SCSS, I added an override to force the previous/next buttons to always be visible, even after the control hides them
...
		&.k-scrollview {

			.k-scrollview-prev, .k-scrollview-next {

				//Prevent the control from hiding these buttons when it reaches the 'end'
				//We will be using some custom logic to force the 'wrap around'
				display:flex !important;
...
Then I subscribed click events and did some manual handling on the buttons
//After the page load & scroll view is initialized...

//note: $slides is a jquery instance that the scrollView is attached to
let scrollView = $slides.data("kendoScrollView");

let $prev = $slides.find('.k-scrollview-prev');
let $next = $slides.find('.k-scrollview-next');
$prev.on("click", function (e) {
	// NOTE: Here we are looking at an 'internal' variable, this is dependent on the version of Kendo we are using - may need to change
	// in the future
	// I figured this out by looking at the implementation in the source
	//		\src\js\kendo.scrollview.js
	let pageCount = scrollView._content.pageCount;
	let currentPage = scrollView._content.page;
	if (pageCount > 1 && currentPage === 0) {
		e.preventDefault();
		e.stopPropagation();
		scrollView.scrollTo(pageCount-1);
	}
});

$next.on("click", function (e) {
	let pageCount = scrollView._content.pageCount;
	let currentPage = scrollView._content.page;
	if (pageCount > 1 && currentPage === pageCount - 1) {
		e.preventDefault();
		e.stopPropagation();
		scrollView.scrollTo(0);
	}
});
1) Expanding a node gets VERY slow when expanding, taking several minutes to complete -- Is there anything we can do (short of partitioning the data) to make this go faster?
2) When expanding a large number of nodes, the chart gets unweildy. For example, if I have a top node, then five nodes below that, and expand one of those five nodes, it spreads out every node on the second row, even though only one of those nodes needs to be spread out to allow room to display the nodes under it. -- Is there anything we can do to keep the display more compact, and avoid unnecessary spreading? (See attached for example.)
Have just tripped over the following whereby html escaped title data is being shown in the Excel column headers when the grid is exported to Excel.
To illustrate the problem run the following dojo
https://dojo.telerik.com/AwUMarUl
As you can see the first column title is not shown due to the angled brackets
The second column has the angled brackets escaped so the title shows correctly in the grid.
Now when the grid is exported the column headings are as follows:
<Product Name> <Unit Price>
which is not what is expected ... Any & all html escaped characters should be un-escaped.
Regards
Alan
I am running into an issue with allowing copy/paste of dates into the filter and cell input fields. Currently, the date fields have validation to support MM/dd/yyyy, and users of the app may be trying to copy dates in that are MM/dd/yy. I would expect Kendo to auto format the date to MM/dd/yyyy after the paste happens, or at least allow support for that, but it doesn't seem to happen.
In the cell, when putting in MM/dd/yy, a validation message appears saying the date is invalid, and there doesn't appear to be a way to override that. In the filter, when putting in MM/dd/yy and submitting the filter, it doesn't stick and completely ignores the date put in.
Steps to reproduce (filter):
- Copy a date formatted as MM/dd/yy
- Paste it into a date column filter
- Attempt to apply filter
- Notice that the filter is ignored
Steps to reproduce (cell edit):
- Copy a date formatted as MM/dd/yy
- Paste it into a cell datepicker field
- Notice the validation flags it as an invalid date
While upgrading and testing the latest 2024.4.1112 release I have noticed the loading indicator, for both the ComboBox and MultiColumnComboBox, has moved from the dropdown button to inside the edit control.
Is this a a bug or a design decision?
If it is the latter I can find no mention of this breaking change in the release notes, or were you hoping nobody would notice?
To me the old design whereby the loading indicator replaced the dropdown arrow was more logical giving the impression to a user the button was unavailable.
So my finial question ... How do we get the old functionality back?
Regards
Alan
var chart = $("#chart").data("kendoChart");
var series = [];

$(theData.Serieses).each(function (index) {
	series.push({
		name: theData.Serieses[index].Name,
		field: theData.Serieses[index].Name,
		data: theData.Serieses[index].SeriesPoints,
		xField: "X",
		yField: "Y",
		color: theData.Serieses[index].Colour,
		markers: {
			type: theData.Serieses[index].Shape
		}
	});
});
chart.setOptions({ series: series, noData: series.length == 0 });
chart.redraw();
console.log(chart.options);
When updating a chart after instantiation, because noData defaults to true, the overlay is shown immediately
if you try and set noData via setOptions then redraw(), the overlay is still in place
Honestly, this should have been marked as a breaking change as every single chart has to be updated to force noData to false just to show initially
there is no binding for noData
e.g.
noData?: boolean | undefined; interface ChartOptions {
name?: string | undefined;
autoBind?: boolean | undefined;
axisDefaults?: ChartAxisDefaults | undefined;
categoryAxis?: ChartCategoryAxisItem | ChartCategoryAxisItem[] | undefined;
chartArea?: ChartChartArea | undefined;
dataSource?: any|any|kendo.data.DataSource | undefined;
legend?: ChartLegend | undefined;
panes?: ChartPane[] | undefined;
pannable?: boolean | ChartPannable | undefined;
pdf?: ChartPdf | undefined;
persistSeriesVisibility?: boolean | undefined;
plotArea?: ChartPlotArea | undefined;
renderAs?: string | undefined;
series?: ChartSeriesItem[] | undefined;
seriesColors?: any;
seriesDefaults?: ChartSeriesDefaults | undefined;
theme?: string | undefined;
subtitle?: string | ChartSubtitle | undefined;
title?: string | ChartTitle | undefined;
tooltip?: ChartTooltip | undefined;
transitions?: boolean | undefined;
valueAxis?: ChartValueAxisItem | ChartValueAxisItem[] | undefined;
xAxis?: ChartXAxisItem | ChartXAxisItem[] | undefined;
yAxis?: ChartYAxisItem | ChartYAxisItem[] | undefined;
zoomable?: boolean | ChartZoomable | undefined;
axisLabelClick?(e: ChartAxisLabelClickEvent): void;
dataBound?(e: ChartDataBoundEvent): void;
drag?(e: ChartDragEvent): void;
dragEnd?(e: ChartDragEndEvent): void;
dragStart?(e: ChartDragStartEvent): void;
legendItemClick?(e: ChartLegendItemClickEvent): void;
legendItemHover?(e: ChartLegendItemHoverEvent): void;
legendItemLeave?(e: ChartLegendItemLeaveEvent): void;
noteClick?(e: ChartNoteClickEvent): void;
noteHover?(e: ChartNoteHoverEvent): void;
noteLeave?(e: ChartNoteLeaveEvent): void;
paneRender?(e: ChartPaneRenderEvent): void;
plotAreaClick?(e: ChartPlotAreaClickEvent): void;
plotAreaHover?(e: ChartPlotAreaHoverEvent): void;
plotAreaLeave?(e: ChartPlotAreaLeaveEvent): void;
render?(e: ChartRenderEvent): void;
select?(e: ChartSelectEvent): void;
selectEnd?(e: ChartSelectEndEvent): void;
selectStart?(e: ChartSelectStartEvent): void;
seriesClick?(e: ChartSeriesClickEvent): void;
seriesHover?(e: ChartSeriesHoverEvent): void;
seriesOver?(e: ChartSeriesOverEvent): void;
seriesLeave?(e: ChartSeriesLeaveEvent): void;
zoom?(e: ChartZoomEvent): void;
zoomEnd?(e: ChartZoomEndEvent): void;
zoomStart?(e: ChartZoomStartEvent): void;
}
Line Chart Crosshair doesn't display on Tablets.
Display's fine on Desktop & also on Mobile, but tested on iPad and Android tablets the Crosshair line does not display.
kendo.2020.1.114
https://dojo.telerik.com/yBSdUQYS demonstrates the issue:
When a grid detail row is expanded, and pushUpdate() is called on it, the row collapses.
What is expected is for the grid row to remain in its prior state (expanded or collapsed.)
Until this is fixed, is there a work-around, other than manually re-expanding the detail row(s)? This is not a feasible work-around in which multiple nested grid rows are collapses and re-expanded, as this causes the UI to jump unexpectedly for the user.
Hello,
We're interested in a date input wheel (see attached images) as it is a feature that is especially for useful for mobile users. Telerik's technical support directed us here since the date widget doesn't offer this feature currently.
Kind regards
Bug report
Line Chart Crosshair doesn't display on iPad iOS 17
Reproduction of the problem
Dojo: https://dojo.telerik.com/mGtuUvac
Expected/desired behavior
Crosshair shall display on tap
Environment
Browser: [all]