While the Diagram component is nice it is not explicitly constrained to OrgChart behavior with custom drill-up and built-in drill-down capability like the control for the ASP.NET AJAX suite has and thus trying to implement it as such would consume too much time. The Diagram component is amazing and certainly has valid use cases but to extend it for use as an OrgChart with all the behaviors that exist in the pure AJAX control would be a pain.
Add built-in support for guidelines that will be visible as an infinite grid of lines, with a snap-to capability.
It would be nice if the diagram control could have undo/redo event.
You should include a flowchart demo for your diagram tool. It is possible - somewhat - but you are not even including a demo for it, while vendors like syncfusion do!

The way I found out a flowchart was possible was because of the Kendo UI cookbook and cookbook code files.
https://www.packtpub.com/web-development/kendo-ui-cookbook

Seriously, I don't know why you are not including a demo for a flowchart in your demo list for the diagram tool; this should be a no-brainer to include, and in theory, you should not even have to build anything new, just use the diagram tool you have already made.
I would like to see some graphical documentation to show the structure of the controls created by Kendo. I'm imagining an exploded diagram or something like this picture: ( http://bit.ly/VKIgHn ). But instead of kindle hardware - there are layers of the divs, blocks, sub containers and other working parts of the widget. This would also include what base styles ( k-widget, etc) are on each block. In particular - I'm trying to re-style your calendar widget and the element view in Chrome debugger tools has the data - but it's very hard to get a good overview in all that dense text :)
It will be nice to create shapes with rounded borders
Hi,
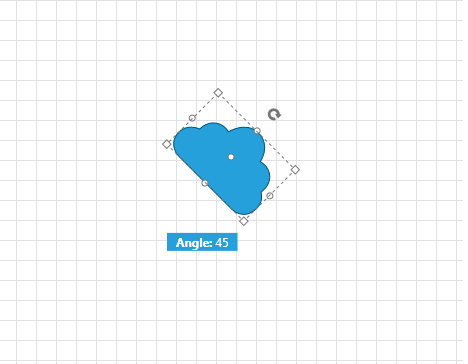
Your documentation mentions the rotation-thumb and also allows for some styling:
https://docs.telerik.com/kendo-ui/api/javascript/dataviz/ui/diagram/configuration/editable.rotate
The only problem is, I cannot get it to display.
See: https://jsfiddle.net/6qmgj521/
Beware: I do NOT mean the 90 degree rotation buttons in the toolbar, but the rotation-thumb adorner!
I expect to see:

Kind regards,
Hans van Essen
Hi Team,
I'd like to request the Kendo UI Diagram to include a double click event in future releases similar to the click event.
Thank you
Bug report
In a Diagram, if you have a lot of nested data, a "Maximum call stack size exceeded" error is thrown.
Reproduction of the problem
- Open this example - https://dojo.telerik.com/OcOBaFoq/3
Current behavior
A Maximum call stack size exceeded error is thrown
Expected/desired behavior
No errors should be thrown.
Environment
- Kendo UI version: 2023.3.1010
- Browser: [all]
Automatic Layout and Data Source in case of non-TreeView data

In the diagram control automatic layout and data source works just for a tree view. For example in a non tree view data we would have several levels with items that can have multiple parents. In this case I have to create the items in the diagram manually...it would be nice to update this behaviour and to be able to use the diagram with automatic data source and layout also in the case of a non TreeView data.
It would be nice if there was some kind of alignment property on the TextBlock component in a Diagram, so that the text could be properly centered without needing to calculate the positions within the area.

Maybe having some kind of "container" component with this property that you could place TextBlocks inside would work.
It would be nice if, in addition to "polyline" and "cascading", if there were other options for the shape of the diagram connectors.  I would like to see a "spline" option that possibly follows a similar path to the "cascading" square shape, but flows with curves.   Maybe even a configuration object, instead of a string that could define the parameters of the shape.

{
type: "spline",
mode: "bezier", // or "natual" or any other spline algorithm //
maxCurves: 3, // max number of inversion points in the spline //
curveRadius: 100 // size in pixels //
// any additional properties for configuring the curve, like bezier length, instead of curve radius &c. //
}
It would be nice if the diagram control could support complex shape json export (diagram.save()) and import (diagram.load()), like shapes contains TextBlocks, etc.
It would love to have an export feature for Diagram which will give the possibilty to make an export to Microsoft Visio.
Fish Bone diagram is a nice feature which is very useful for the applications to provide the root cause analysis in any vertical.
Syncfusion is having a nice in built control to do the same.
https://ej2.syncfusion.com/demos/diagram/fishbone-diagram/
A similar feature from Kendo UI is needed to include it in our existing applications.
Add ability to define connection visual template option for the whole connection path. In this way the user can define custom connection types (like 'polyspline' ).
Someting like:
Enhancement
Expose renderAs property in Diagram as it is in Chart
TicketID: 1563168
Environment
Kendo UI version: ]all]
Browser: [all]
It would be nice if the diagram control could support undobale properties load back from saved data. And also if shapes, connections could acquire this property (not only through diagram.addShape and diagram.addConnection).
When connections are detached from shapes or drawn via API with coords instead of shape ends, they don't move with selection when multiple shapes/connections are selected. When these "floating" connections are selected in a multiselect scenario, they should move with the rest of the selection.
