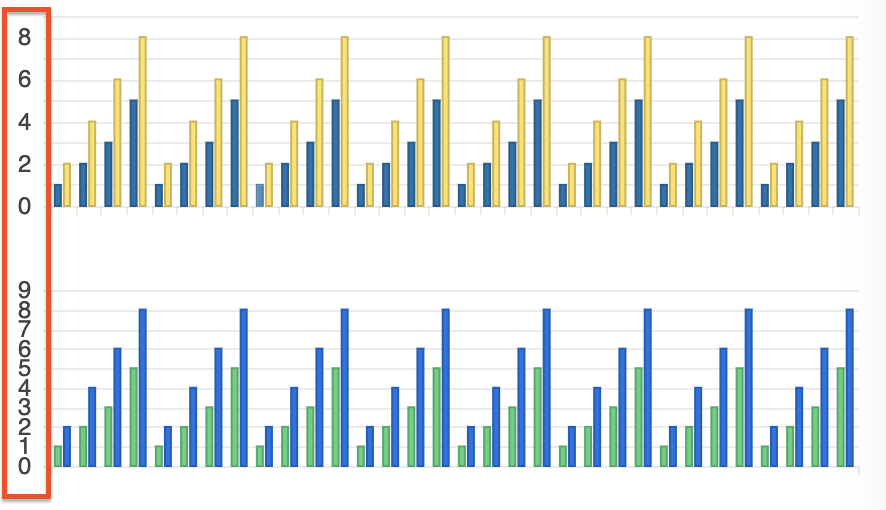
I need to change the background of an area chart at certain values.
I want to display critical threshold. It could be like in the attached photo with some gradient but normal color blocks or even just some straight lines at the thresholds would be okay. Is there any option to achiev something like that?
We have enjoyed using Kendo UI and the chart tooling that is provided, but our business cases are beginning to need advanced data visualization beyond the chart types currently available.
The additional chart types we need are:
- Marimekko Chart
- Parallel Sets
- Alluvial Diagram
- Waterfall Plot (not the same as the waterfall chart currently available, which is great too!)
- Lollipop Chart
This feature request is already logged in the Kendo UI for jQuery portal and upon implementation would be nice to bring the feature also to Kendo UI for Angular Charts.
https://feedback.telerik.com/kendo-jquery-ui/1358671-support-quarters-in-date-series-just-like-weeks
We have noticed that the labels on the y-axis are rendered too close together, almost touching each other. This can be configured by setting the step option.
However, it could be ideal in such cases for the step to be determined automatically by the Chart based on the available space (similar to the rotation option which rotates the label, but in this case to control the step).
Please provide an option to automatically render the labels based on the available space.
We've already implemented several Kendo Chart performance optimization techniques, including:
- Canvas Rendering.
- Inline Series Binding.
- Disabling Animated Transitions.
- Disabling Gradients.
- Hiding Minor Grid Lines.
- Date Grouping using Category Axis in Date Mode.
However we are still experiencing issues when using large amounts of data.
Hi team,
Please provide an animate property part of the Tooltip interface and all tooltip-related components:
https://www.telerik.com/kendo-angular-ui/components/charts/api/TooltipComponent/
https://www.telerik.com/kendo-angular-ui/components/charts/api/ValueAxisCrosshairTooltipComponent/
https://www.telerik.com/kendo-angular-ui/components/charts/api/SeriesTooltipComponent/
..etc
Currently, the tooltip animations can be disabled through the tooltipInstance.tooltip property of the Chart reference:
@ViewChild('chart') public chart: ChartComponent;
ngAfterViewInit() {
    this.chart.tooltipInstance.animate = false;
}
I would like to request a component similar to the old TreeMap widget, but with some added functionality.  It would be great if there were native functionality in the component to drill deeper into a hierarchy rather than always having to look at the top level view (i.e. clicking a sub node would "zoom in" to view it as the new root level node).

This example treemap and sunburst (implemented using d3.js) are along the lines of what I'm suggesting.

http://mbostock.github.io/d3/talk/20111018/treemap.html
http://bl.ocks.org/mbostock/4348373
Hi,
Please provide an ability to set the axis range in the drag/zoom events.
Thanks
Please provide the Charts selection functionality for vertical category axis as well.
thank you
I want to align the Chart Plot Area on the left side (similar to the position property of the Legend component).
Currently, the same can be achieved only with the Drawing API in render event handler. Here is an example:
https://stackblitz.com/edit/angular-ucwo6p
Providing a built-in position option for alignment of the Plot Area will be an easier and intuitive appraoch.
Thanks.
It would be great if your pan and zoom had sliders to more easily navigate a long duration chart.
See these couple examples: https://www.amcharts.com/demos/line-chart-with-range-slider/ https://www.amcharts.com/demos/zoomable-value-axis/
Please provide a global Charts font property that allows to set the font for all Chart elements.
Thank you.
Hi,
In the current implementation of the Kendo Chart, I'm utilizing the "panable" feature to enable movement of the chart horizontally. However, after zooming, I would prefer to utilize scrollbars instead of dragging to navigate through the chart. I would like to request a feature that allows for this behavior.
Thank you for your consideration.
We have a case with a chart with values: Date-Value that only applies to working days.
Non of the current options of missingValues ("gap" | "interpolate" | "zero") suits us. Interpolate is the closest option but it pretends to have 2 additional points (Sat & Sun) between Friday and Monday while we prefer just to connect directly Friday and Monday so both label and chart-line shape showns that 4 weeks (28 days) data based chart is based on 20 points and not 28 points (20 real points and 8 interpolated points).
Can this be achived currently? If not can you extend missingValues with additonal option (eg. "ignore") to do as explained above?
Thanks,
Tomasz
Component kendo-chart-navigator has to be usable also with other chart types not only stockchart.
We think that could be really useful to move it from StockChartModule  to ChartModule and find a way to use it in a new way!

See for example:

http://plnkr.co/edit/CYTIcQYcx3SqSLEFCA59
Hi,
Please provide an option that allows forcing the chart to use whole numbers for its value axis when zooming in or out. It's not something uncommon to have charts that can't have decimals (eg. number of people).
Thank you
We have this feature in Kendo Grid:
<ng-template kendoGridNoRecordsTemplate>
  <fa-icon [icon]="faCloudXmark" class="fa-2x"></fa-icon>
  <p>There is no data to display.</p>
</ng-template>Currently, the Radar Chart cannot be zoomed in/out. Please, provide a zoomable property that would allow the developer to achieve this functionality.