Hi team,
Please provide an animate property part of the Tooltip interface and all tooltip-related components:
https://www.telerik.com/kendo-angular-ui/components/charts/api/TooltipComponent/
https://www.telerik.com/kendo-angular-ui/components/charts/api/ValueAxisCrosshairTooltipComponent/
https://www.telerik.com/kendo-angular-ui/components/charts/api/SeriesTooltipComponent/
..etc
Currently, the tooltip animations can be disabled through the tooltipInstance.tooltip property of the Chart reference:
@ViewChild('chart') public chart: ChartComponent;
ngAfterViewInit() {
    this.chart.tooltipInstance.animate = false;
}
Severity: Sev2 (High)
Test Environment: OS: Windows 11 22H2
OS Build: 23620.1000
Pre-Requisite: Set browser zoom level to 400% and display resolution: 1280x1024 (or) In dev Tools set the resolution to 320*256.
Repro steps:
1.Open URL: http://www.telerik.com/kendo-ui in edge browser.
2.Navigate to 'Kendo UI for Angular ' tab item and invoke it.
3.Navigate to the Angular chart control and invoke it.
4.In left navigation pane click Scatter control under 'series types'.
5.Navigate to 'Scatter Plot Chart'.
6.Verify whether X-axis is getting overlapped while resizing the page upto 400% of zoom or not.
Actual Result:
X-axis is getting overlapped while resizing the page upto 400% of zoom.
Expected Result:
X-axis should not get overlapped when browser zoom level set to 400%.
Hello ,
Kindly Have issue with stacked bar when try to draw two items in chart with specified with as the below
<kendo-chart-series>
  <kendo-chart-series-item type="bar" [stack]="{ type: '100%' }" [data]="[97]">
  </kendo-chart-series-item>
  <kendo-chart-series-item type="bar" [stack]="{ type: '100%' }" [data]="[7]">
  </kendo-chart-series-item>
</kendo-chart-series>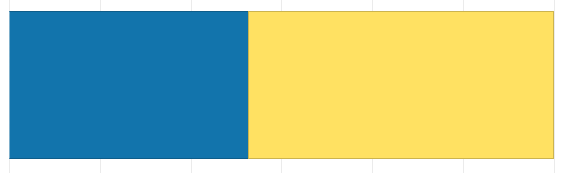
Can Anyone help on that ?
Hi,
In the current implementation of the Kendo Chart, I'm utilizing the "panable" feature to enable movement of the chart horizontally. However, after zooming, I would prefer to utilize scrollbars instead of dragging to navigate through the chart. I would like to request a feature that allows for this behavior.
Thank you for your consideration.
Hello,
The feature applies mainly to scatter plots and is as follows:
* The user has the ability to select individual data points by clicking on them after which they are highlighted.
* The user has the ability to select regions of points by clicking and dragging. These regions can be a lasso, rectangle, oval, free form, or any other shape.
* The user has the ability to select multiple points or regions of points simultaneously (i.e. previously selected points/regions don't "unselect" when the user selects new ones).
An example of this is this Lightning Charts example: https://lightningchart.com/lightningchart-js-interactive-examples/edit/lcjs-example-0040-customLassoInteraction.html?isList=true
I'm also attaching a script that you can copy and paste into the example above which shows the ability to select rectangular regions and individual data points.
Hi,
Please provide an option that allows forcing the chart to use whole numbers for its value axis when zooming in or out. It's not something uncommon to have charts that can't have decimals (eg. number of people).
Thank you
We have this feature in Kendo Grid:
<ng-template kendoGridNoRecordsTemplate>
  <fa-icon [icon]="faCloudXmark" class="fa-2x"></fa-icon>
  <p>There is no data to display.</p>
</ng-template>Currently, the Radar Chart cannot be zoomed in/out. Please, provide a zoomable property that would allow the developer to achieve this functionality.
Hi,
Can you improve the behaviour of AxisDefaultLabels content to automatically use multiple lines when labels are overlapped instead of split them manually by using the function ?
Actual :

Expected :
Thank you for your consideration.
Hi Kendo Theme,
The current behavior will re-render the Chart and the tooltip or crosshair disappear and the user will need again to hover over the series. This behavior can be observed in the following example:
https://stackblitz.com/edit/angular-dmpexe-sf8zoj?file=src%2Fapp%2Fapp.component.ts
The desired behavior would be to keep the popup open or the crosshair present when updating the data.
Thank you for your consideration.
Currently, the width property is available only for horizontally oriented legend:

Provide an option to set the width of the legend when orientation is set to vertical.
Hi,
Please provide an option to render a Legend for the Chart Pane components.
thanks
It will be a good addition to the chart types if the Marimekko Chart was introduced. This chart type is useful for visualizing categorical data distributions with variable column widths.
Hi,
This documentation Stackblitz demo is broken (see screenshot below for details).

Hi,
Please provide an ability to set the axis range in the drag/zoom events.
Thanks
I need to change the background of an area chart at certain values.
I want to display critical threshold. It could be like in the attached photo with some gradient but normal color blocks or even just some straight lines at the thresholds would be okay. Is there any option to achiev something like that?