Hi!
I'm building a Blazor Component using your TelerikChart. To build my chart, I'm dynamically inserting the series name and the series data, which is pulled from a list. I also have a button on the page that changes the dataset (last month, this month, next month, etc). The button will rebuild the list of names and data, and Blazor will build the chart with a 'foreach' entry in the ChartSeriesItems section of the Chart Component.
The problem is that the Items are not cleared each time. When I click the button, I'm getting previous values. In the example below, I have 3 data sets. The first has 4 items, the second has 8 and the third has 6. If the user clicks the second, showing all 8, then clicks the first, the chart will show the new 4, and the previous 5-8 from the second set.
My chart description in HTML is:
...
<ChartSeriesItems>
@foreach(Tuple<string, object[]> t in myData)
{
<ChartSeries Type="ChartSeriesType.Column" Name=@t.Item1 Data=@t.Item2 />
}
</ChartSeriesItems>
...
I have checked my data through debugging to ensure that the myData variable is correct (i.e. when I click the first data, it only has 4 items). However, when the chart displays, it shows 8 items.
Is there a CLEARDATA method or something I can call on the Chart to ensure that the data is reset each time? I see that there is a Clear() in JavaScript, but I'm writing in only Blazor and C#, with no JavaScript.
I've attached the .razor page for your reference. (As this is my test code, I'm using random number generation to get the data.)
Thank you so much for your help!!
-Cheryl Simpson
When I place a Chart in a small container, for example, a div, the labels are cut off and thus unreadable.
===
ADMIN EDIT
===
A possible workaround for the time being is changing the position of the labels so they are not cut off. For example: https://blazorrepl.telerik.com/mHkNkCEC16hMJnTg26.
After updating the chart data, some elements remain in the DOM. This can clutter the browser if the data updates come in on intervals and the chart remains in operation for a while. A screenshot is attached below.
MCVE:
@using Telerik.Blazor@using Telerik.Blazor.Components.Button@using Telerik.Blazor.Components.Chart<h3>Chart</h3><TelerikButton Primary="true" @onclick="AddDataPoint">Add data point</TelerikButton><TelerikChart Transitions="false"> <TelerikChartSeriesItems> <TelerikChartSeries Type="ChartSeriesType.Line" Name="CPU Usage Data" Data="@simpleData"> </TelerikChartSeries> </TelerikChartSeriesItems> <TelerikChartValueAxes> <TelerikChartValueAxis Max="100" Color="black"></TelerikChartValueAxis> </TelerikChartValueAxes> <TelerikChartTitle Text="CPU Usage"></TelerikChartTitle> <TelerikChartLegend Position="Telerik.Blazor.ChartLegendPosition.Bottom"> </TelerikChartLegend></TelerikChart>@code { void AddDataPoint() { Random random = new Random(); var _val = Math.Round((random.NextDouble() * 100), 3); if (simpleData.Count >= 60) { simpleData = simpleData.TakeLast(59).ToList(); } simpleData.Add(_val); //StateHasChanged(); } public List<object> simpleData = new List<object>();}
---
ADMIN EDIT
Screen recording attached below, code to reproduce it too.
---
I am trying to customize the format of the ChartCategoryAxisLabels to render the abbreviated name of the day of the week using the following format:
<ChartCategoryAxisLabels Format="ddd dd/MM HH:mm"/>While it is a valid format, it seems that it doesn't work for the category labels.
---
ADMIN EDIT
---
For the time being, you can use the following to render the abbreviated name of the day of the week in the ChartCategoryAxisLabels:
<ChartCategoryAxisLabels Format="{0:EEE dd/MM HH:mm}"/>The additional functionality of the stock chart (crosshairs, navigator) fits our needs very well, but our data is not currency formatted. As far as we have found, we have not seen a way to remove currency as a default format. I'm not sure if this is a bug, or intended functionality; but it's preventing us from rolling charts with that extended functionality.
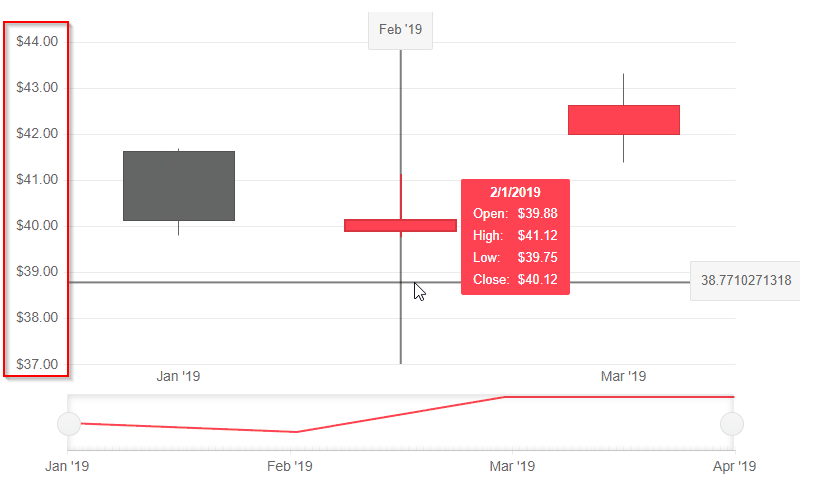
Hi,
Just a bug I have found. I have found something similar before with the DateTime format of a category axis.
Please note the single lowercase 't' in the below appears to be being interpreted by the compiler as 'time' identifier (AM or PM). In this case, it is printing on the chart label as 'a'.
<ChartValueAxes>
     <ChartValueAxis AxisCrossingValue="@AxisCrossingValue">
          <ChartValueAxisLabels Format="@("{0}" + " a b c d e f g h i j k l m n o p q r s t u v w x y z")"></ChartValueAxisLabels>
    </ChartValueAxis>
</ChartValueAxes>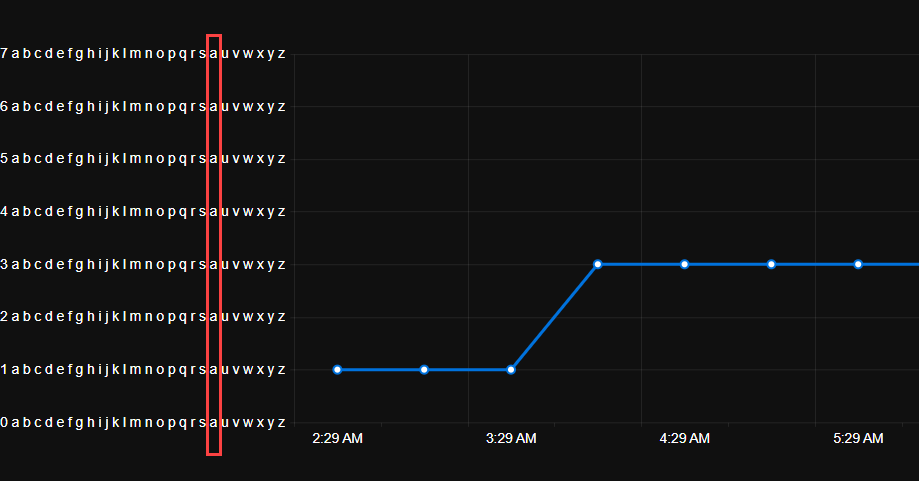
I discovered this as my original unit was 'Count' which was being displayed at runtime on the chart as 'Couna'.
Hi, I can't figure how to use the Min/Max properties of the ChartCategoryAxis because if I set these properties, the chart disappears.
Please help me.
@page "/"

<TelerikChart>

    <ChartSeriesItems>
        <ChartSeries Type="ChartSeriesType.Line" Name="Test" Data="@mesures"
                     Field="@nameof(Mesure.Value)" CategoryField="@nameof(Mesure.Date)" Aggregate="ChartSeriesAggregate.Sum">
        </ChartSeries>
    </ChartSeriesItems>

    <ChartCategoryAxes>
        <!-- This is OK -->
        @*<ChartCategoryAxis BaseUnit="ChartCategoryAxisBaseUnit.Hours" Type="ChartCategoryAxisType.Date" BaseUnitStep="1"></ChartCategoryAxis>*@

        <!-- This isn't : nothing is displayed -->
        <ChartCategoryAxis Min="@MinDate" Max="@MaxDate" BaseUnit="ChartCategoryAxisBaseUnit.Hours" Type="ChartCategoryAxisType.Date" BaseUnitStep="1"></ChartCategoryAxis>
    </ChartCategoryAxes>

</TelerikChart>

@code {

    private DateTime MinDate { get; set; } = new DateTime(2019, 01, 01, 13, 0, 0);
    private DateTime MaxDate { get; set; }   = new DateTime(2019, 01, 01, 17, 0, 0);

    public class Mesure
    {
        public DateTime Date { get; set; }
        public int Value { get; set; }
    }

    public List<Mesure> mesures = new List<Mesure>()
    {
        new Mesure() { Date = new DateTime(2019, 01, 01, 13, 0, 0), Value = 1 },
        new Mesure() { Date = new DateTime(2019, 01, 01, 14, 0, 0), Value = 2 },
        new Mesure() { Date = new DateTime(2019, 01, 01, 14, 30, 0), Value = 3 },
        new Mesure() { Date = new DateTime(2019, 01, 01, 14, 35, 0), Value = 4 },
        new Mesure() { Date = new DateTime(2019, 01, 01, 15, 0, 0), Value = 5 },
        new Mesure() { Date = new DateTime(2019, 01, 01, 16, 0, 0), Value = 6 },
        new Mesure() { Date = new DateTime(2019, 01, 01, 17, 0, 0), Value = 7 },
    };
}The Chart Tooltip does not render correct values for the data points when the chart is bound to a model, has multiple series and Template is used. The DataItem does not seem to work as expected.
ADMIN EDIT:
If the Chart is bound with Independent Series Binding the FormattedValue will get the correct values.
If the Chart has no Template the correct values for the data points will be displayed
The Scatterline Chart is flipped upside down if the Height is under 100px.
Reproduction1. Run this REPL
2. Set the height of the Chart to 90px
3. The chart is rendered upside down
To reproduce the problem, hover over the last value of the series. While the Tooltip enters, it causes horizontal and vertical scroll and flickers. Then, it is positioned correctly.
The issue is better observed if you increase the transition speed of the Tooltip wrapper.
Reproduction: https://blazorrepl.telerik.com/cREDloaV42j7Z19G13.
===
ADMIN EDIT
===
A possible workaround for the time being is to alter or stop the Tooltip animation with CSS. Here is a runnable sample demonstrating the approach: https://blazorrepl.telerik.com/QnEjvIOC04hXA6W709
Hi,
We tried making the name property of our TelerikChartSeries dynamic by binding it to a string value. This however seems to completely crash startup, the browser tab freezes and the console doesn't show any errors. If we just put in a simple string in the Name property the application runs without a problem.
<TelerikChartSeries Type="ChartSeriesType.Column" Name="@Team1Name" Data="@Results" Field="@nameof(ChartViewModel.Team1Score)" CategoryField="@nameof(ChartViewModel.CategoryName)">
    <TelerikChartSeriesLabels Visible="true" />
</TelerikChartSeries>
As you can see in this example we're binding the Name property to Team1Name which can be changed whenever another team is selected from a dropdownlist.
Thank you in advance.
The context DataItem is null for subsequent ChartSeries. It receives the correct object for the first ChartSeries, but for the rest is null.
<Admin Edit>
A workaround, for the time being, would be to remove the Template and let the Tooltip display the default value, which will be correct.
</Admin Edit>
Reproduction code:
<TelerikChart>
    <ChartTitle Text="Unrecoverable Errors Per Minute vs. Signal Level" />
    <ChartCategoryAxes>
        <ChartCategoryAxis Type="@ChartCategoryAxisType.Category" />
    </ChartCategoryAxes>
    <ChartValueAxes>
        <ChartValueAxis>
            <ChartValueAxisLabels Visible="true" />
        </ChartValueAxis>
    </ChartValueAxes>

    <ChartTooltip Visible="true">
        <Template>
            @{
                var data = context.DataItem as ModelData;
                <div class="card" style="font-size: 0.8rem; color: black">
                    <span>@($"{data.Value}")</span>
                    <span>@($"{data.Type}")</span>

                </div>
            }
        </Template>
    </ChartTooltip>

    <ChartSeriesItems>
        <ChartSeries Type="ChartSeriesType.Line"
                     Data="@ChartData1"
                     CategoryField="@nameof(ModelData.Type)"
                     Field="@nameof(ModelData.Value)">
        </ChartSeries>
        <ChartSeries Type="ChartSeriesType.Line"
                     Data="@ChartData2"
                     CategoryField="@nameof(ModelData.Type)"
                     Field="@nameof(ModelData.Value)">
        </ChartSeries>
        <ChartSeries Type="ChartSeriesType.Line"
                     Data="@ChartData3"
                     CategoryField="@nameof(ModelData.Type)"
                     Field="@nameof(ModelData.Value)">
        </ChartSeries>
    </ChartSeriesItems>

</TelerikChart>

@code {
    public class ModelData
    {
        public string Type { get; set; }
        public double Value { get; set; }
    }

    public List<ModelData> ChartData1 = new List<ModelData>() { new ModelData() { Type = "S1", Value = 1 } };
    public List<ModelData> ChartData2 = new List<ModelData>() { new ModelData() { Type = "S2", Value = 5 } };
    public List<ModelData> ChartData3 = new List<ModelData>() { new ModelData() { Type = "S3", Value = 9 } };
}
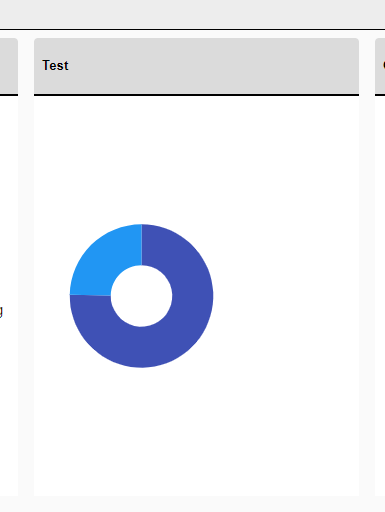
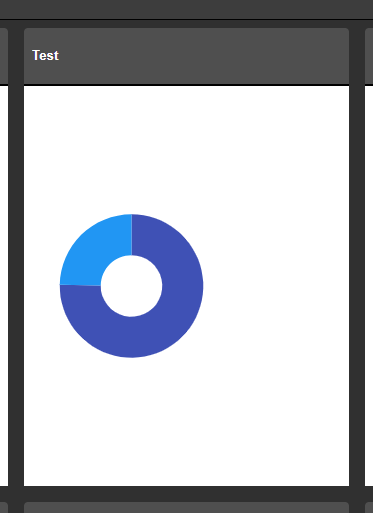
Our Site supports multiple themes that we have built using the SASS Theme Builder. For all Telerik Components we have used so far the theme changes on them as expected when using the example found here (Change Theme at Runtime). The problem seems to be the chart component will not adhere to the newly applied theme after its initial load. Seems like this is because it is shown as an SVG with hardcoded attributes on the element. Is there a workaround for this (other than reloading the components entirely)?
Before & After Theme Change:
I have a line chart I am using to plot two related series of data. When these two series have the same values, or very similar values, the series that is second in the render order completely covers up the first line. This makes it look like the first line isn't being rendered, and makes it impossible to access the tooltips for the first series. I need a way to disambiguate overlapping data.
Thank you