Hi,
I would like to be able to show / hide a serie by clicking to a legend.
Is there a way to do it actually ?
I would like to visually distinguish a certain element in a series from the others if its value matches a given criteria (for example, value exceeds a threshold). Ideally, I'd want to add a hash to my bars, because I want to keep all items with the same color (I don't want to use the ColorField).
Something similar is available in Kendo: https://demos.telerik.com/kendo-ui/bar-charts/visuals.
Hi!
I'm building a Blazor Component using your TelerikChart. To build my chart, I'm dynamically inserting the series name and the series data, which is pulled from a list. I also have a button on the page that changes the dataset (last month, this month, next month, etc). The button will rebuild the list of names and data, and Blazor will build the chart with a 'foreach' entry in the ChartSeriesItems section of the Chart Component.
The problem is that the Items are not cleared each time. When I click the button, I'm getting previous values. In the example below, I have 3 data sets. The first has 4 items, the second has 8 and the third has 6. If the user clicks the second, showing all 8, then clicks the first, the chart will show the new 4, and the previous 5-8 from the second set.
My chart description in HTML is:
...
<ChartSeriesItems>
@foreach(Tuple<string, object[]> t in myData)
{
<ChartSeries Type="ChartSeriesType.Column" Name=@t.Item1 Data=@t.Item2 />
}
</ChartSeriesItems>
...
I have checked my data through debugging to ensure that the myData variable is correct (i.e. when I click the first data, it only has 4 items). However, when the chart displays, it shows 8 items.
Is there a CLEARDATA method or something I can call on the Chart to ensure that the data is reset each time? I see that there is a Clear() in JavaScript, but I'm writing in only Blazor and C#, with no JavaScript.
I've attached the .razor page for your reference. (As this is my test code, I'm using random number generation to get the data.)
Thank you so much for your help!!
-Cheryl Simpson
Hi, I can't figure how to use the Min/Max properties of the ChartCategoryAxis because if I set these properties, the chart disappears.
Please help me.
@page "/"

<TelerikChart>

    <ChartSeriesItems>
        <ChartSeries Type="ChartSeriesType.Line" Name="Test" Data="@mesures"
                     Field="@nameof(Mesure.Value)" CategoryField="@nameof(Mesure.Date)" Aggregate="ChartSeriesAggregate.Sum">
        </ChartSeries>
    </ChartSeriesItems>

    <ChartCategoryAxes>
        <!-- This is OK -->
        @*<ChartCategoryAxis BaseUnit="ChartCategoryAxisBaseUnit.Hours" Type="ChartCategoryAxisType.Date" BaseUnitStep="1"></ChartCategoryAxis>*@

        <!-- This isn't : nothing is displayed -->
        <ChartCategoryAxis Min="@MinDate" Max="@MaxDate" BaseUnit="ChartCategoryAxisBaseUnit.Hours" Type="ChartCategoryAxisType.Date" BaseUnitStep="1"></ChartCategoryAxis>
    </ChartCategoryAxes>

</TelerikChart>

@code {

    private DateTime MinDate { get; set; } = new DateTime(2019, 01, 01, 13, 0, 0);
    private DateTime MaxDate { get; set; }   = new DateTime(2019, 01, 01, 17, 0, 0);

    public class Mesure
    {
        public DateTime Date { get; set; }
        public int Value { get; set; }
    }

    public List<Mesure> mesures = new List<Mesure>()
    {
        new Mesure() { Date = new DateTime(2019, 01, 01, 13, 0, 0), Value = 1 },
        new Mesure() { Date = new DateTime(2019, 01, 01, 14, 0, 0), Value = 2 },
        new Mesure() { Date = new DateTime(2019, 01, 01, 14, 30, 0), Value = 3 },
        new Mesure() { Date = new DateTime(2019, 01, 01, 14, 35, 0), Value = 4 },
        new Mesure() { Date = new DateTime(2019, 01, 01, 15, 0, 0), Value = 5 },
        new Mesure() { Date = new DateTime(2019, 01, 01, 16, 0, 0), Value = 6 },
        new Mesure() { Date = new DateTime(2019, 01, 01, 17, 0, 0), Value = 7 },
    };
}What we are looking for is really just a means to change the legend text color, and other text colors, as well as being able to set a background.
For instance:
Through the Telerik theme we would not be able to do this, maybe on one chart, but not different styles for each of the 3 charts.
Possibly also having the chart to resize as the browser resizes, with an included Delay of 20ms. Just a thought.
It would be helpful to me if this chart type was supported.
I have a page where I am displaying a chart and associated data in a grid below.
Being able to range select in the chart like in the asp.net core link below would offer a much better user experience.
That way the selected range could be specifically targeted in the grid data below the chart.
If a chart is too narrow and x-axis labels overlap, the user can zoom out and refresh the charts to allow the labels to fit. This feature request is to allow the charts to reformat themselves as the zoom level is changed (without having to refresh the page). Steps to reproduce:
- Make browser narrow (say half screen)
- Change zoom to 500%
- Go to https://demos.telerik.com/blazor-ui/chart/line-chart
- See line chart is squished with overlapping x-axis labels
- Zoom out to 100%
- See line chart remains squished with overlapping x-axis labels even though there is a lot more room
- Now refresh the page
- See line chart is no longer squished with x-axis labels visible
After updating the chart data, some elements remain in the DOM. This can clutter the browser if the data updates come in on intervals and the chart remains in operation for a while. A screenshot is attached below.
MCVE:
@using Telerik.Blazor@using Telerik.Blazor.Components.Button@using Telerik.Blazor.Components.Chart<h3>Chart</h3><TelerikButton Primary="true" @onclick="AddDataPoint">Add data point</TelerikButton><TelerikChart Transitions="false"> <TelerikChartSeriesItems> <TelerikChartSeries Type="ChartSeriesType.Line" Name="CPU Usage Data" Data="@simpleData"> </TelerikChartSeries> </TelerikChartSeriesItems> <TelerikChartValueAxes> <TelerikChartValueAxis Max="100" Color="black"></TelerikChartValueAxis> </TelerikChartValueAxes> <TelerikChartTitle Text="CPU Usage"></TelerikChartTitle> <TelerikChartLegend Position="Telerik.Blazor.ChartLegendPosition.Bottom"> </TelerikChartLegend></TelerikChart>@code { void AddDataPoint() { Random random = new Random(); var _val = Math.Round((random.NextDouble() * 100), 3); if (simpleData.Count >= 60) { simpleData = simpleData.TakeLast(59).ToList(); } simpleData.Add(_val); //StateHasChanged(); } public List<object> simpleData = new List<object>();}
Hi,
We tried making the name property of our TelerikChartSeries dynamic by binding it to a string value. This however seems to completely crash startup, the browser tab freezes and the console doesn't show any errors. If we just put in a simple string in the Name property the application runs without a problem.
<TelerikChartSeries Type="ChartSeriesType.Column" Name="@Team1Name" Data="@Results" Field="@nameof(ChartViewModel.Team1Score)" CategoryField="@nameof(ChartViewModel.CategoryName)">
    <TelerikChartSeriesLabels Visible="true" />
</TelerikChartSeries>
As you can see in this example we're binding the Name property to Team1Name which can be changed whenever another team is selected from a dropdownlist.
Thank you in advance.
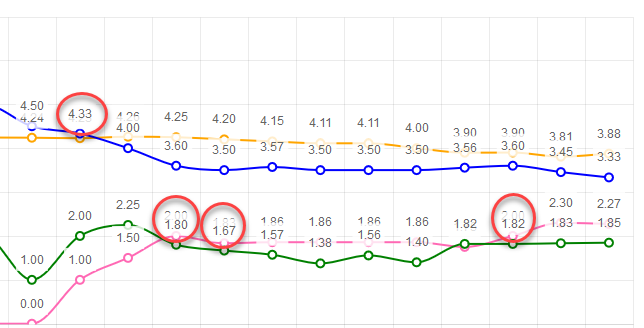
The idea is to ensure labels don't render on top of each other. If series values are close to each other, labels start overlapping. Having tooltips will let me remove the labels.
Example: