Bug report
Reproduction of the problem
Dojo example.
- Run the example
Current behavior
The Chart's animation does not work when it is nested in the Splitter.
Expected/desired behavior
The Chart's animation should work.
Environment
- Kendo UI version: 2021.1.119
- jQuery version: x.y
- Browser: [all]
### Bug report
The label configuration is not available for the plotband when using the TagHelper version of the Bar Chart.
### Reproduction of the problem
1. Open the following REPL sample: https://netcorerepl.telerik.com/woEMFDll17ui7F4122
2. The label of the plotband is not available.
3. The label option is available when defining the Chart by using HtmlHelpers: https://netcorerepl.telerik.com/QSYMvNFP187x0nAl24
### Expected/desired behavior
The plotband must have a label option.
### Environment
* **Telerik UI for ASP.NET Core version: 2024.3.806
* **Browser: [all]
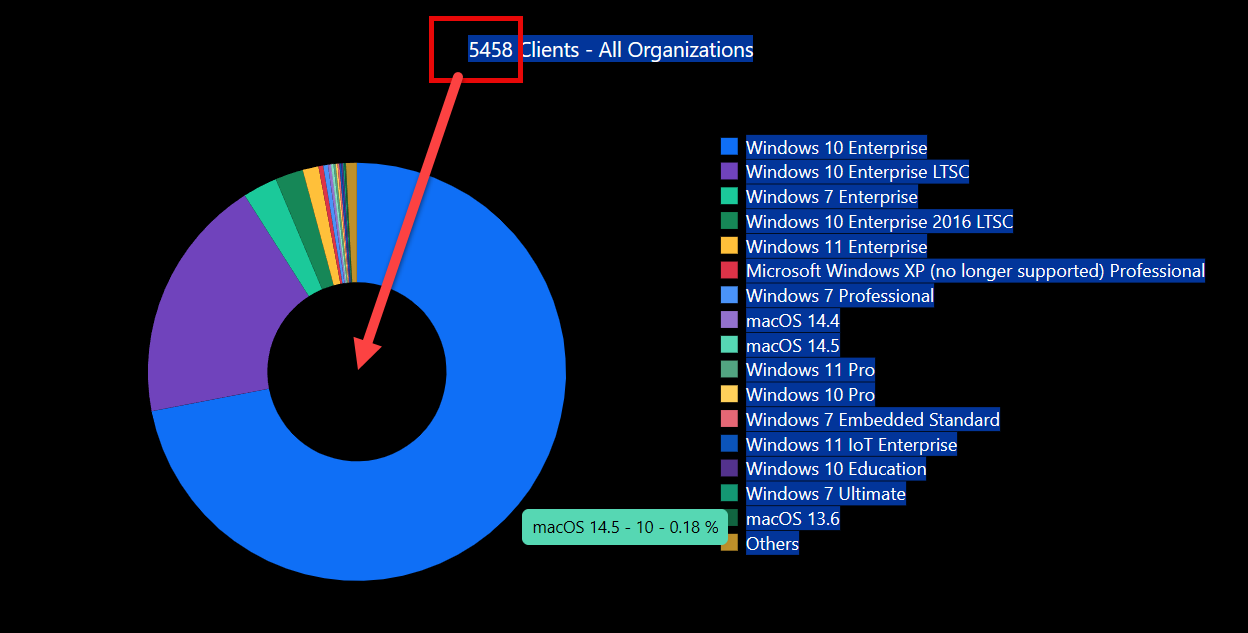
The current suggestions are IMHO quite complicated and require a lot of client-side code.
I would like to have a way to display the total of the series in the center.
The content should change depending on the selected categories.
Maybe using a template with access to the values.
The size of the content should scaled to optimally fill the empty center.
Kind regards Erwin
You can see the legend on the right hand side is showing every
instance of the same type. Is there a away that it can only show one
instance of each and toggle all types of that type. i.e. it would only
show Cheese, Bread, Jam
Clicking cheese would unselect Cheese in both groups.
I also cannot find a way to display any way of differentiating the two groups
Is there a way to add a label to show this? (Like I have drawn one and two on the series)

Feature request for adding a custom class to the label text for the items in the Telerik UI Chart.
The desired result is the labels to receive and apply CSS styles.
By design, the axisDefaults configuration of the Kendo UI for jQuery Chart allows you to set the rotation of the labels to "auto":
axisDefaults: {
    ...
    labels: {
      rotation: "auto"
    },
  }

//OR

axisDefaults: {
    ...
    labels: {
      rotation: {
        angle: "auto"
      }
    },
  }
At this stage, when using Telerik UI for ASP.NET Core Chart, the Rotation() method does not accept a string value. Also, the Angle() option accepts only a double value. Is it possible to implement an additional overload that allows setting the labels rotation to "auto"?
For example:
.AxisDefaults(ad => ad.Labels(l => l.Rotation("auto")))Or
.AxisDefaults(ad => ad.Labels(l => l.Rotation(r => r.Angle("auto"))))
I need the Chart series to be able to use a value of the Model to get their names instead of it always being a manually configured string.
At this stage, the BaseUnit() method of the CategoryAxis configuration does not provide "Milliseconds" option. Is it possible to include it?
The PlotArea option of the DonutChart does not include the Height option that is available in jQuery:
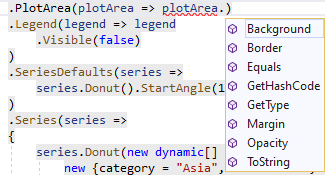
Please reference the support ticket number:
1527560
The radar chart needs support for 2 CategoryAxis similar to the line and column chart. In the ticket above, I have shared a screenshot of how the radar chart would look like. Due to confidential reasons, I am not sharing it on the public Feedback portal.
As mentioned in this feature request for area-range chart series: "having area 'scatter' support, such as 'scatterArea', and 'scatterAreaRange', like the existing 'scatterLine', is also desirable".
Please see this forum post for details.
Hello,
Using Donut Chart with provided option for zooming and panning doesn't change appearance.
@(Html.Kendo().Chart()
.Name("tagChart")
.ChartArea(chartArea => chartArea
.Background("transparent").Height(1200).Width(1200))
.Title(title => title
.Text("Dicom Tags")
.Position(ChartTitlePosition.Bottom)
)
.Legend(legend => legend
.Visible(false)
)
.SeriesDefaults(series =>
series.Donut().StartAngle(15)
).Zoomable(z => z.Mousewheel(true))
.Pannable(true)
Is any way to get it working?
Thanks
We have the need to create a chart to display Risk Information. Below is the image of a risk matrix as defined on pages 96 in AFPAM63-128 https://static.e-publishing.af.mil/production/1/saf_aq/publication/afpam63-128/afpam63-128.pdf -- there are more examples on page 101
Another example of a risk matrix can be seen on page 18 here -> https://static.e-publishing.af.mil/production/1/af_se/publication/afi90-802/afi90-802.pdf
I've copied the images here for convenience.
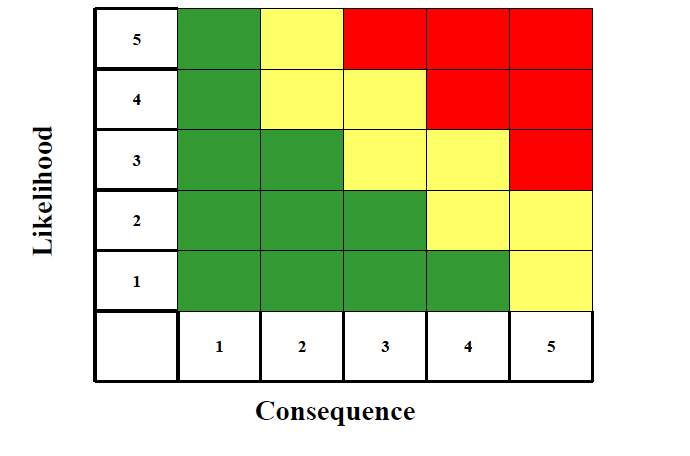
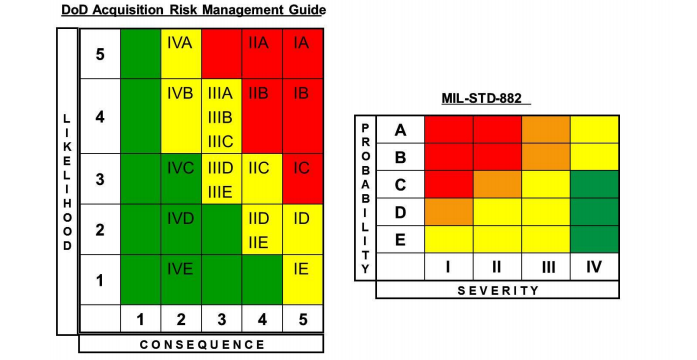
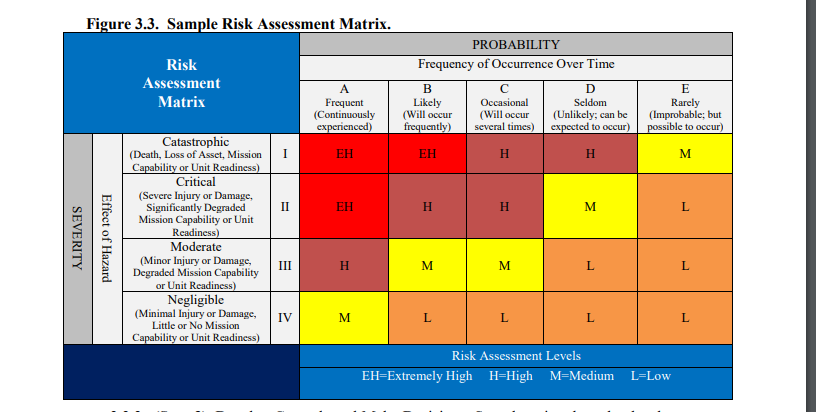
Would it be possible to add this to the Kendo Chart backlog?
For computations in a custom aggregate function it would be very helpful to have the start and end DateTimes for the current category at hand. Right now the category parameter just provides a single DateTime which is the start DateTime of the category. The end DateTime can only be calculated with a workaround provided by Tsvetina
(see this ticket: https://www.telerik.com/account/support-tickets/view-ticket/1386149)