Hi there,
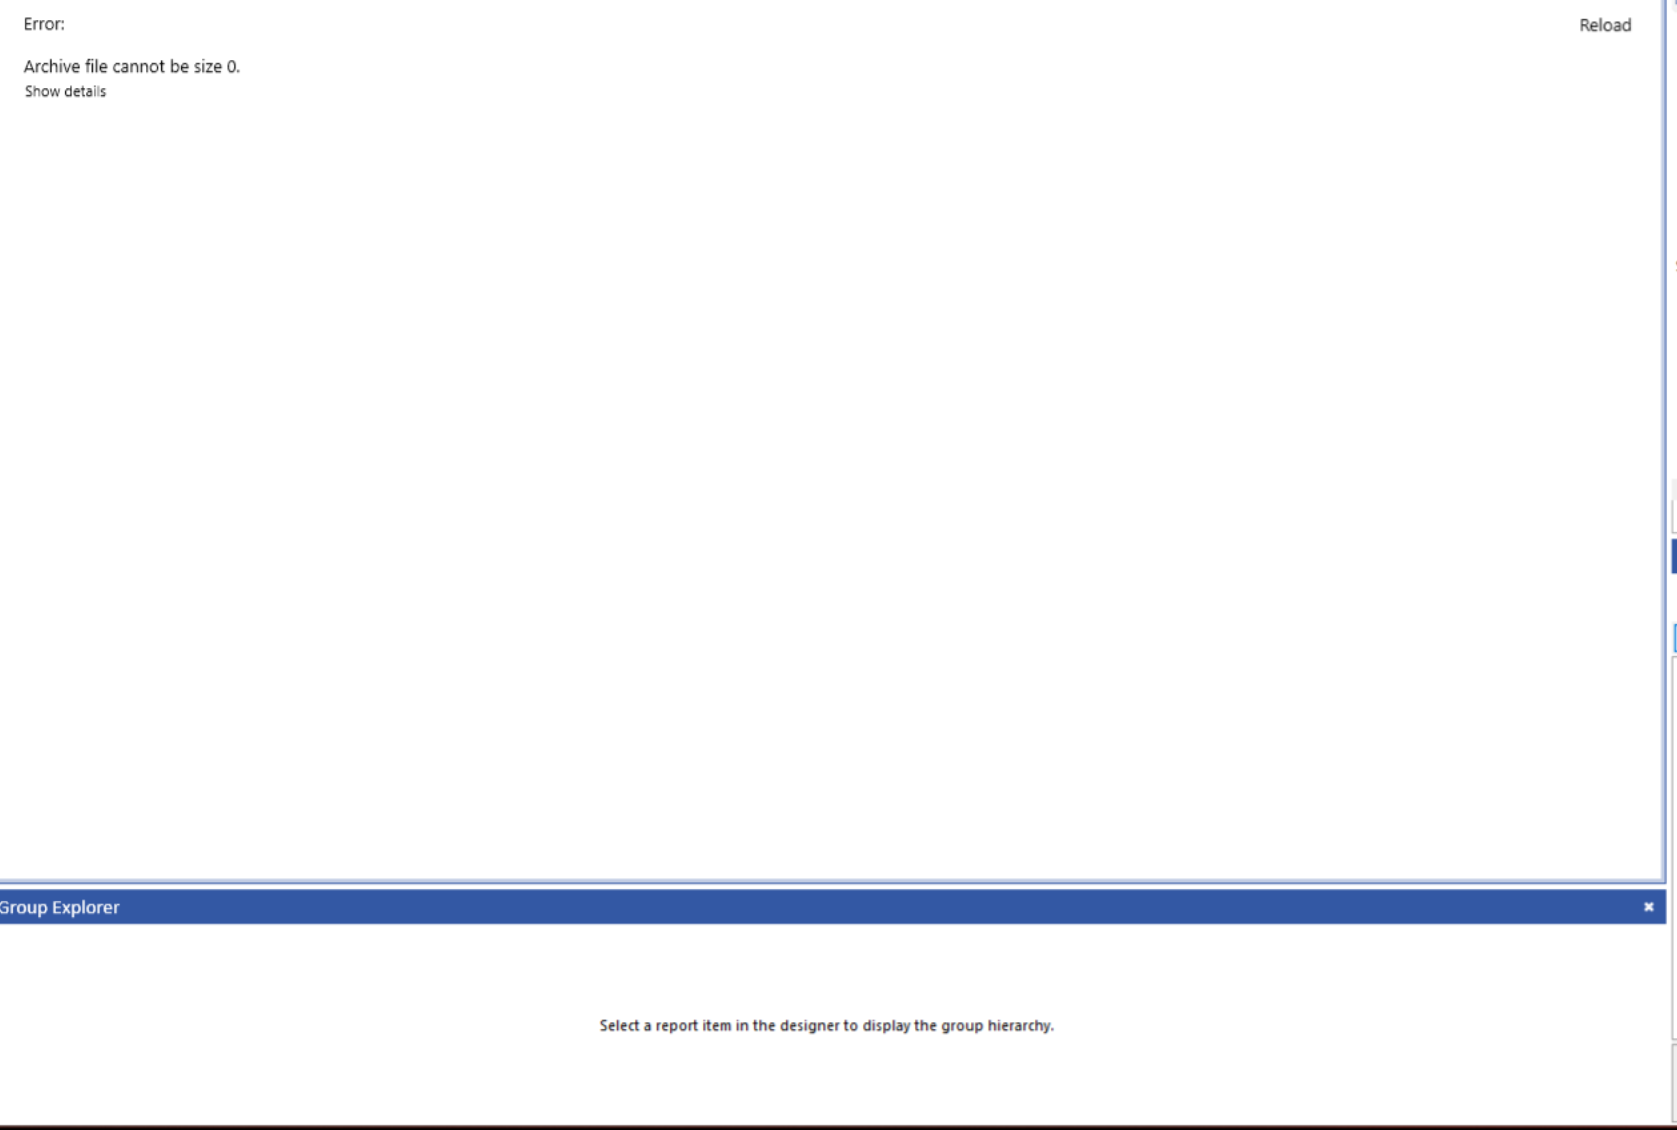
Adding an external style sheet to a report in a report-book triggers an error when previewing the report book, "Object reference not set to an instance of an object"
I've attached the bare minimum project to reproduce the error.
I've also tried upgrading to R3 2020
Cheers
In my Graph, I have set the AccessibleRole and AccessibleDescription. The alternative text is read correctly by the Acrobat Reader's 'Read out Loud' functionality.
The problem is that it keeps reading it multiple times.
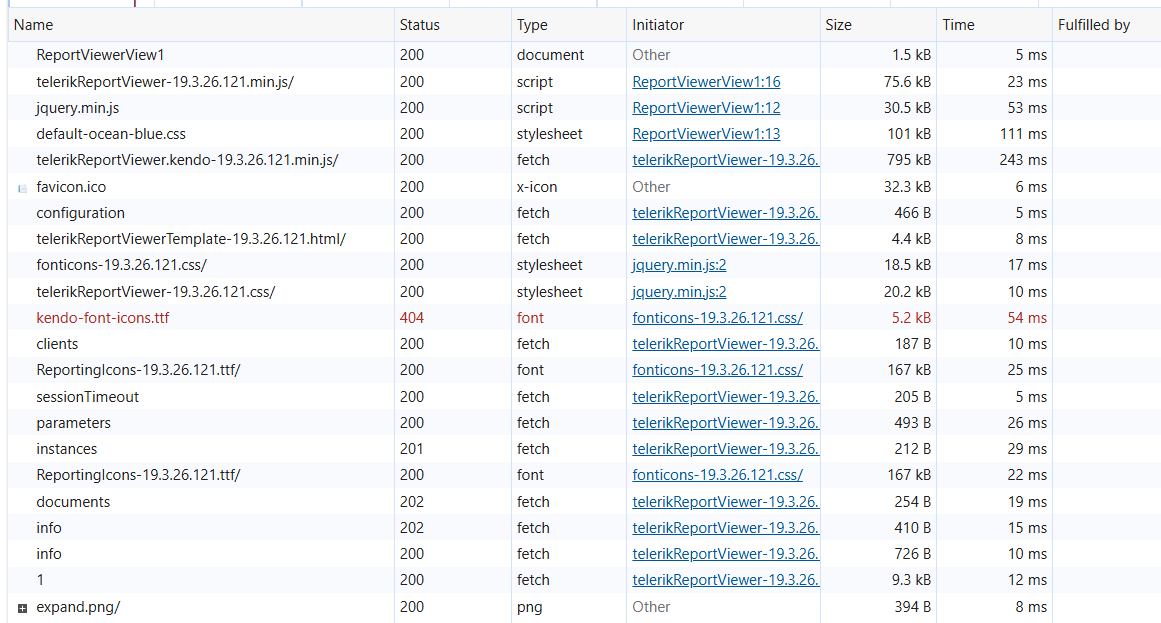
The HTML5-based report viewers send 404 request to `/sass/fonts/kendo-font-icons.ttf` when font icons are being used:
I use the exportBegin event to prevent the default export logic. However, when I do that, the default viewer notification remains, and I have to hide it manually:
                    exportBegin: function (e, args) {
                        args.handled = true; // Set to true to cancel the default export behavior.
                        //...
                        $(".trv-notification").addClass("k-hidden");
                    },
Currently, graph axes do not provide a way to render separator lines between category groups. While this is generally not an issue for simple scenarios, it can make charts with nested categories difficult to read.
For example, when a graph displays multiple subcategories under a parent category (such as revenue ranges grouped by quarter), there is no built-in visual indicator showing where one parent category ends and the next begins.
It would be useful to provide support for category separators on graph axes, allowing report authors to visually separate category groups and improve readability when working with hierarchical data.
When a report is saved in the Web Report Designer, a popup appears confirming that the report was successfully saved. However, it is visible for far too long and blocks users during this time.
This feature request is to add an 'ok', 'hide' or 'close' button to these types of popups so the user can dismiss it.
Thank you,
Shannon
Double-click selection in the expression editor isn't context-aware. In almost every other application, double-clicking selects a token based on its surrounding context — a single field/identifier when clicking on a field, or the word boundary within a string literal when clicking inside quotes. The expression editor doesn't respect these boundaries, so its double-click behaviour is inconsistent with the standard expression-editor behaviour users expect.
Expected: Double-click selects the relevant token based on context (e.g. an individual field reference, or a word within a string literal).
Actual: Double-click selection ignores context and does not match the token/word-boundary behaviour found in virtually all other expression editors and text inputs.
It would be great if you could introduce the ability to create custom reusable color palettes in Telerik Report Designer, so I don't have to declare the same set of colors for each chart I need them.
If you have a lot of graphs in your report then it is more convenient to change the color palette one place.
Currently, when you set SplitWorksheetOnPageBreak to True, the Excel Sheet name is formed from the DocumentName or ReportName and the number of the page.
It would be very helpful if the report authors can manipulate these names with Expressions.
When using screen reader applications like JAWS or Narrator, those tools read accessible reporting PDFs in an incorrect order. For example, if I have two items in the report, the reader will read the second item first.
Additionally, images whose AccessibleDescription I have set may be read multiple times..
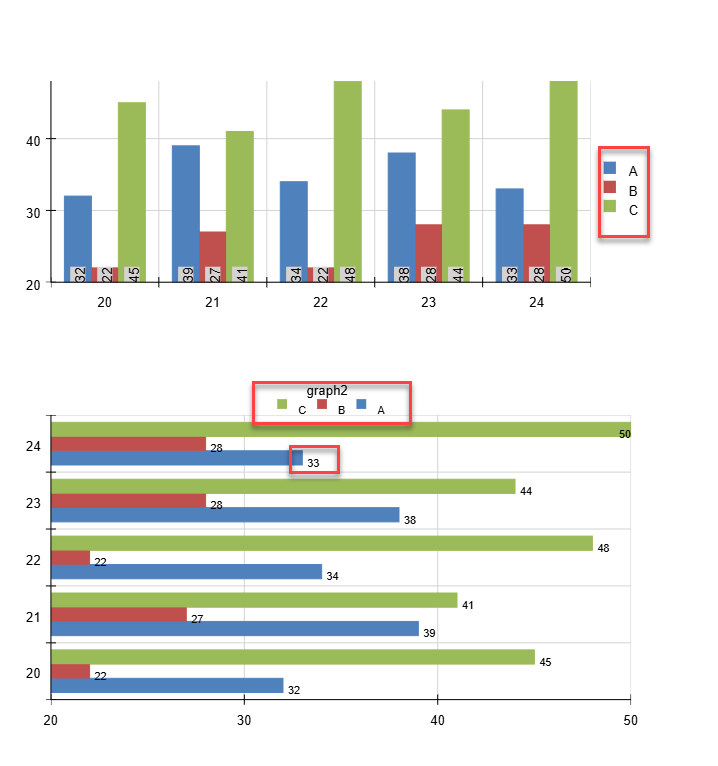
I have graphs in my report. I render them with Skia on Linux. The issue reproduces with Skia on Windows as well.
The legend labels are not aligned well with the color icon, and data labels on a horizontal bar chart (with OutsideEnd) are misaligned as well:
When I display a report in a web report viewer, whose service is running on a server where one or more of the used fonts are not available, the first instance of the item(s) that use those fonts is being substituted with another font. The rest of the items do render with the original font, however.
This creates confusion and inconsistency. We should use the substituted font because it's used for measuring when using Print Preview mode in the web viewers, or when rendering to pdf via print/export.
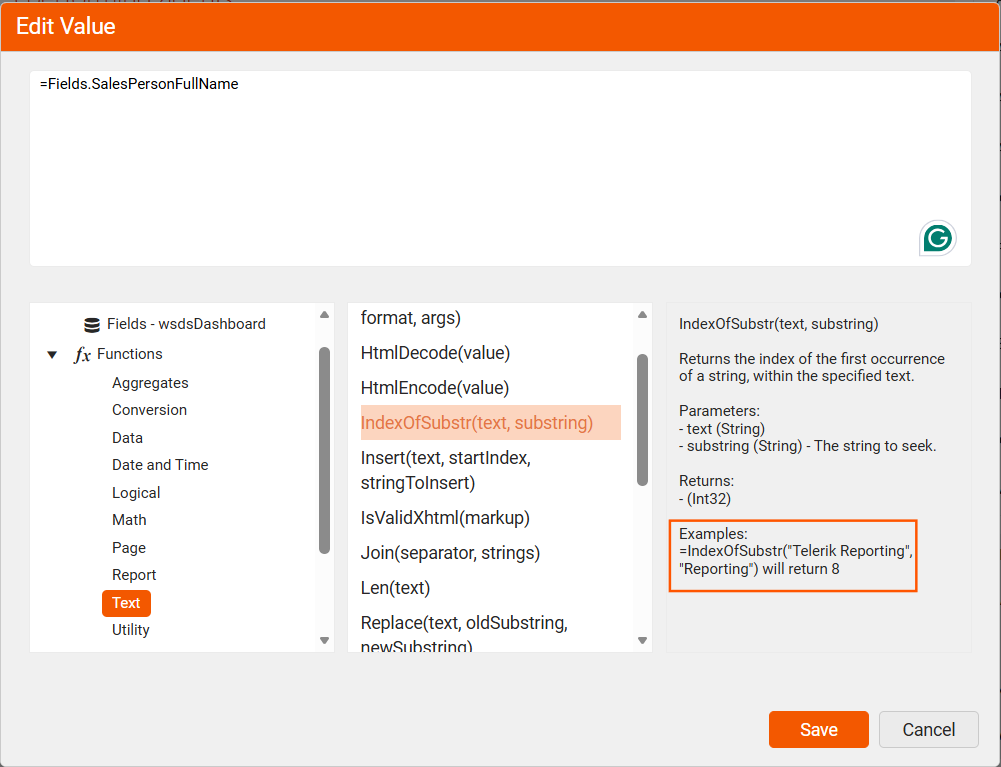
If I open the expression dialog in the Web Report Designer and select one of the available functions, I will see a sample snippet in the third column below the expression area.
This column is not selectable, so I cannot copy the example and test it out. This example should be copyable, so that each function can be easily tested in the report designer.