Unplanned
Last Updated: 13 Jan 2021 15:12 by ADMIN
In the case of stacked column chart (Chart with BarSeries with Stack CombineMode), and if the data contains negative values, series labels are displayed at the correct position.
Completed
Last Updated: 24 Feb 2021 13:03 by ADMIN
Release R1 2021 SP1

An exception is thrown on Android when this code is executed


            this.chart1.VerticalAxis = new NumericalAxis { Minimum = 300, Maximum = 400 };
            this.chart1.VerticalAxis = new NumericalAxis { Minimum = 100, Maximum = 200 };

Unplanned
Last Updated: 04 May 2020 10:38 by ADMIN
When the chart is zoomed/panned and the data is refreshed asynchronously, the app locks up and eventually crashes on iOS with  NSInvalidArgumentException.
Unplanned
Last Updated: 01 Apr 2020 11:33 by ADMIN
when applying custom label formatter to wrap the categorical axis label text, the text is not wrapped. It works fine on iOS and UWP.
Unplanned
Last Updated: 01 Apr 2020 08:47 by ADMIN

If you have the following PieChart with donut series definition:

<telerikChart:RadPieChart HeightRequest="200" 
                          WidthRequest="200">
    <telerikChart:RadPieChart.Series>
        <telerikChart:DonutSeries ShowLabels="True"
                                  ValueBinding="Value"
                                  ItemsSource="{Binding Data}" />
        <telerikChart:DonutSeries ShowLabels="True"
                                  RadiusFactor="0.45"
                                  ValueBinding="Value"
                                  ItemsSource="{Binding Data1}" />
    </telerikChart:RadPieChart.Series>
</telerikChart:RadPieChart>

On android works as expected:

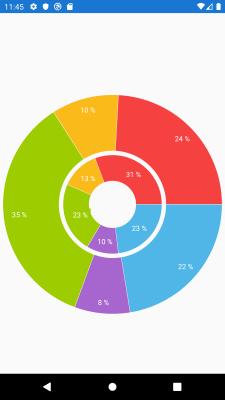
On iOS the series are overlapped and not visualized as expected. The radius factor is not respected

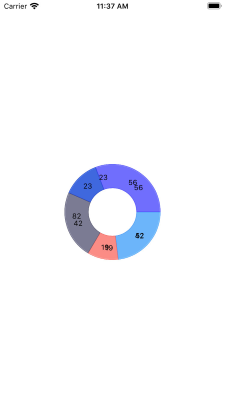
On UWP the second donut series in not visualized and the radius factor is not respected.

Unplanned
Last Updated: 02 Jul 2021 08:26 by ADMIN
The Chart loses all the UI customizations made in the iOS platform renderer when the Series are updated, for example, if you show/hide certain Series or updated their ItemsSource.
Unplanned
Last Updated: 07 Apr 2021 06:37 by Stefan
Applying ChartTrackBallBehavior to a CartesianChart with ScatterLine/ScatterPoint series does not take any effect.
Completed
Last Updated: 06 Nov 2020 14:51 by ADMIN
Release 2020.3.1106 (R3 2020 minor release)
On the Chart control, the labels of the Legend are in a different font than everywhere else on iOS.
Unplanned
Last Updated: 05 Nov 2019 11:08 by ADMIN
If you clear the collection bound to the series ItemsSource and add new items to it, the changes are not reflected on the Chart
Unplanned
Last Updated: 12 Nov 2019 12:55 by ADMIN

As of the latest release (10/04/2019) RadPieChart with a PieSeries having LabelBinding set to a property name, and ShowLabels set to True, with the list of data bound to ItemsSource containing one or more empty pie slices (a null in the list), causes a System.Reflection.TargetException to be thrown on load of the page containing the chart in iOS (this scenario works fine in UWP).

I am using the latest available Visual Studio 2019 (16.3.5) and the latest available Xamarin.Forms package (4.2.0.848062) and testing on an iPad with iOS 13.1.  The reason I need to have a null value in the list is so that the custom color palette I'm applying will always apply the same colors to the same data points (pie slices), even though in some cases, zero or one or two of the three pie slices will have no data value (and so should not appear in the chart, but still "use up" the corresponding color in the 3 colors of the palette).

In the 08/02/2019 release, this scenario worked fine in iOS (the 09/13/2019 release had the https://feedback.telerik.com/xamarin/1431067-chart-ios-invalidcastexception-is-thrown-when-the-chart-is-loaded issue, which is now resolved in the 10/04/2019 release, but which prevented my testing in iOS since in my app I had RadCartesianCharts on the same pages as the RadPieCharts).

The newly broken functionality in iOS could possibly be related to two other items that are marked completed:
https://feedback.telerik.com/xamarin/1366403-piechart-tooltip-behavior-is-not-working-properly (in 10/04/2019 release)
https://feedback.telerik.com/xamarin/1365842-chart-null-value-support (in R3 2018 SP release)

Unplanned
Last Updated: 17 Oct 2019 14:11 by ADMIN
When the series data is updated and axis labels are redrawn, occasionally the default DateTime format is shown in DateTimeContinuousAxis.
Completed
Last Updated: 07 Dec 2020 16:03 by ADMIN
Release 2020.3.1207 (R3 2020 minor release)
When you update the data in the chart so that the vertical axis values are changed - the annotation does not properly update and stays at the same location.

Completed
Last Updated: 04 Oct 2019 14:46 by ADMIN
Release 2019.3.1004 (R3 2019 minor release)
Loading Chart on iOS raises an exception of type InvalidCastException.
Unplanned
Last Updated: 15 Jul 2019 08:38 by ADMIN
When you set custom stroke to ScatterLineSeries, the colors in the RadLegend are not updated.
Unplanned
Last Updated: 16 Jul 2019 09:51 by ADMIN

If you have a Chart with BarSeries and TooltipBehavior defined, the tooltip of each bar is shown only when the user taps in the area around the tip of the bar.

The expected behavior is the tooltip to be displayed when clicking anywhere on the bar.

Unplanned
Last Updated: 09 May 2019 08:39 by ADMIN
When you have some Series defined and dynamically clear and add new Series, those are not displayed correctly on iOS - it seems the vertical axis is not extended, and all the data points are visualized on the horizontal axis.
Unplanned
Last Updated: 24 Apr 2019 12:35 by ADMIN
Setting SelectedPointOffset and RadiusFactor in DonutSeries or PieSeries causes unexpected behavior when selecting a pie piece in the chart.
Unplanned
Last Updated: 05 Apr 2019 08:19 by ADMIN
Once the data of the bar chart is changed, the selection behavior does not fire. The issue is reproducible when the chart is placed inside AnimationPanel,
Unplanned
Last Updated: 01 Apr 2019 10:50 by ADMIN
The issue seems to be down to the width - either calculated or set. Some widths seem to cause the lines to appear - refer to the attached chart_grey_lines.png file.

Workaround: manually calculate the screen width upon load and to set the width to a corresponding lookup value
Unplanned
Last Updated: 22 Mar 2019 13:18 by ADMIN
SelectionChanged event of the Chart SelectionBehavior is not raised for LineSeries when DataPointSelectionMode is "Single" and  SeriesSelectionMode is "None".