Improve performance, when calculating the positions of Smart Labels.
Currently, VisualStudio2012DarkTheme has a white background in order to be able to read the labels. This change was done when addressing this item:
However, it is inconsistent a dark theme to have a white background color. The design should be improved to achieve consistent look and feel.
Use the following setup:
private void RadForm1_Load(object sender, EventArgs e)
{
// TODO: This line of code loads data into the 'nwindDataSet.Orders' table. You can move, or remove it, as needed.this.ordersTableAdapter.Fill(this.nwindDataSet.Orders);
this.radPivotGrid1.RowGroupDescriptions.Add(new DateTimeGroupDescription() { PropertyName = "OrderDate", Step = DateTimeStep.Year, GroupComparer = new GroupNameComparer() });
this.radPivotGrid1.RowGroupDescriptions.Add(new DateTimeGroupDescription() { PropertyName = "OrderDate", Step = DateTimeStep.Quarter, GroupComparer = new GroupNameComparer() });
this.radPivotGrid1.RowGroupDescriptions.Add(new DateTim
eGroupDescription() { PropertyName = "OrderDate", Step = DateTimeStep.Month, GroupComparer = new GroupNameComparer() });
this.radPivotGrid1.ColumnGroupDescriptions.Add(new PropertyGroupDescription() { PropertyName = "EmployeeID", GroupComparer = new GrandTotalComparer() });
this.radPivotGrid1.AggregateDescriptions.Add(new PropertyAggregateDescription() { PropertyName = "Freight", AggregateFunction = AggregateFunctions.Sum });
this.radPivotGrid1.AggregateDescriptions.Add(new PropertyAggregateDescription() { PropertyName = "Freight", AggregateFunction = AggregateFunctions.Average });
this.radPivotGrid1.FilterDescriptions.Add(new PropertyFilterDescription() { PropertyName = "ShipCountry", CustomName = "Country" });
this.radPivotGrid1.DataSource = this.ordersBindingSource;
this.radPivotGrid1.ChartDataProvider.UpdateCompleted += radPivotGrid1_UpdateCompleted;
this.radChartView1.DataSource = this.radPivotGrid1;
}
private void radPivotGrid1_UpdateCompleted(object sender, EventArgs e)
{
foreach (CartesianSeries series inthis.radChartView1.Series)
{
series.ShowLabels = true;
series.LabelRotationAngle = 90;
}
}
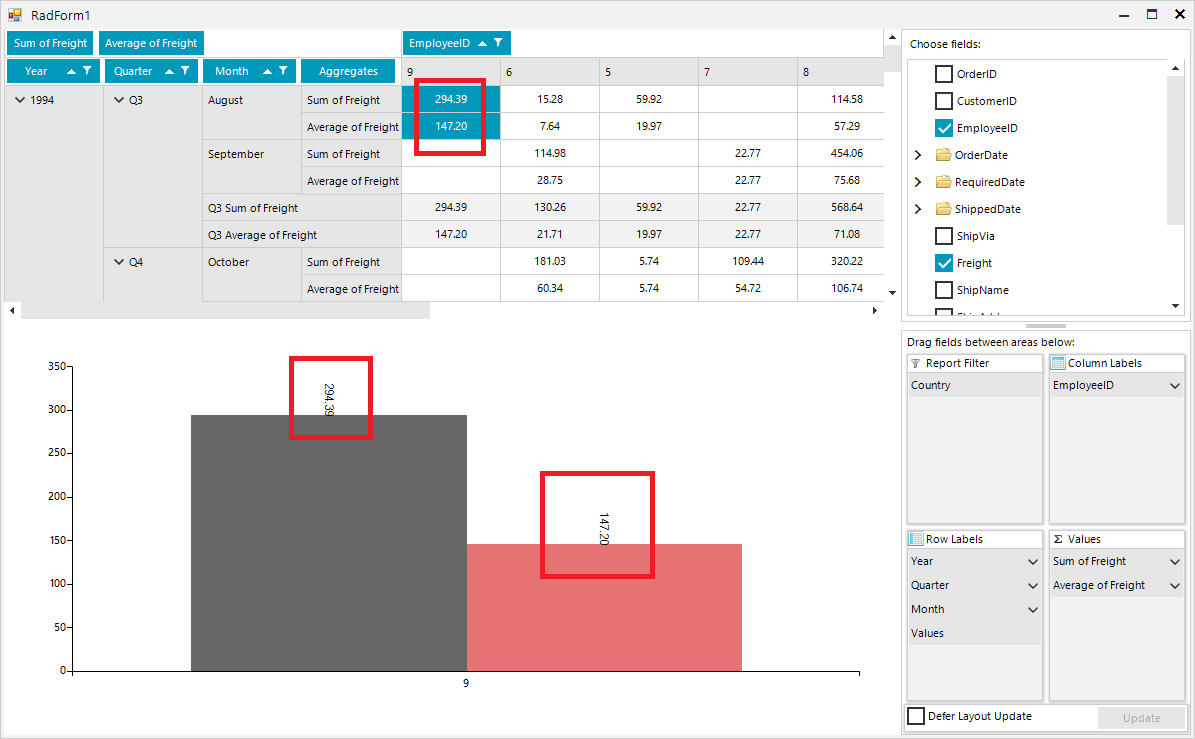
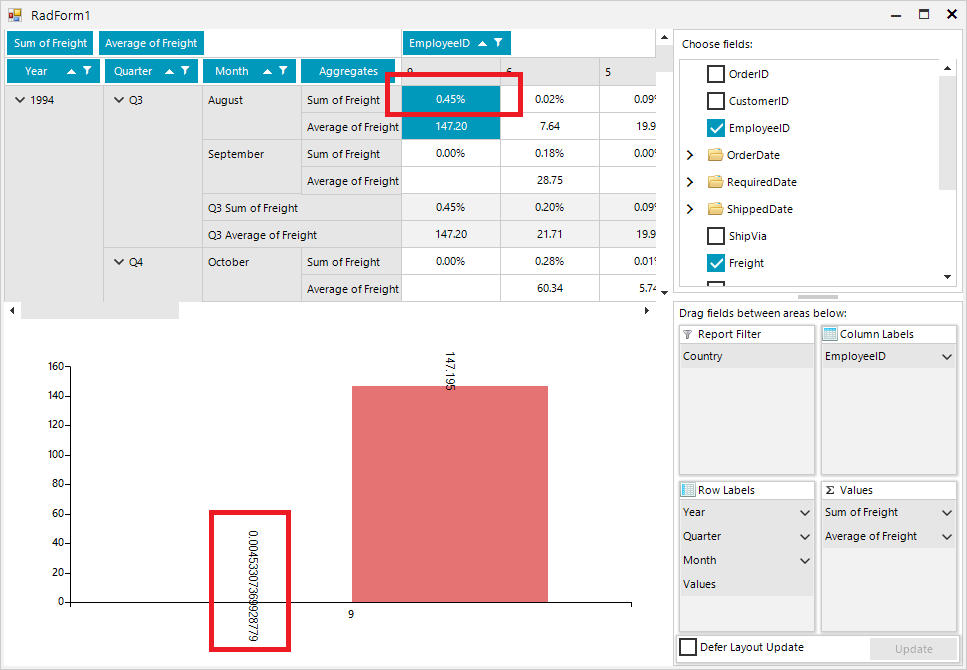
Once you select "% of Grand Total" for one of the aggregates, it would be good the respective chart labels to be formatted in a similar way out of the box:

Desired Behavior:
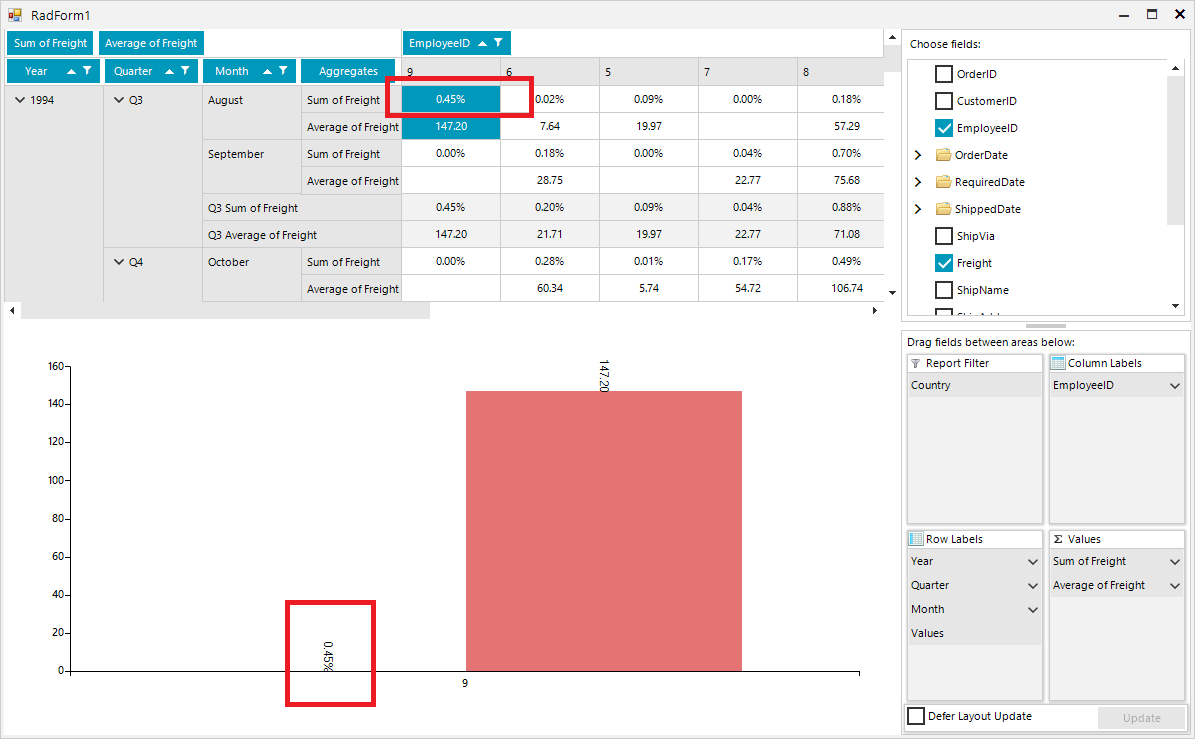
Actual behavior:
RadChartView - user should be able to enter minimum/maximum width for Bars in BarSeries.
It would be very helpful if you either added ScaleBreaks (as in the deprecated RadChart control - http://www.telerik.com/help/winforms/chart-features-scale-breaks.html) or provided an alternative way. I use them a great deal with bar charts and logarithmic scales are not optimal.
RadChartView - Palette of the Series should be with higher priority than Area.View.Palette.
Add null value support for RadChartView
Add Three Line Break Series to RadChartView
Currently, ScatterSeries are able to use NumericAxes only. A good improvement will be to allow using DateTimeContinuousAxes as well.
Axes should allow custom formatting for each individual label. Consider the following scenario - a chart provides information for each hour of the day. Each label should contain only the hours data, however, when the date changes the label should contain the full date information.
Allow user to export current view as an image.
Currently the axis data flows from left to right starting with the smallest values and increasing. There should be a way to verse this flow and the most left values to be the biggest.
Add HLC (high-low-close) Series to RadChartView
Add Renko Series to RadChartView
Add Kagi Series to RadChartView