Recently Updated
Completed
Last Updated:
27 Nov 2023 06:26
by ADMIN
Release R2 2023
Created by:
Sébastien
Comments:
0
Category:
Chart
Type:
Bug Report
Line Series is not drawn when Chart has only two data points. This is a bug in my opinion, this a line can be drawn from 2 points.
Unplanned
Last Updated:
19 Dec 2022 07:03
by ADMIN
Created by:
Sébastien
Comments:
3
Category:
Chart
Type:
Bug Report
Inconsistency in Line and Spline series performance
Unplanned
Last Updated:
15 Jul 2022 11:59
by ADMIN
Created by:
Sébastien
Comments:
6
Category:
Chart
Type:
Bug Report
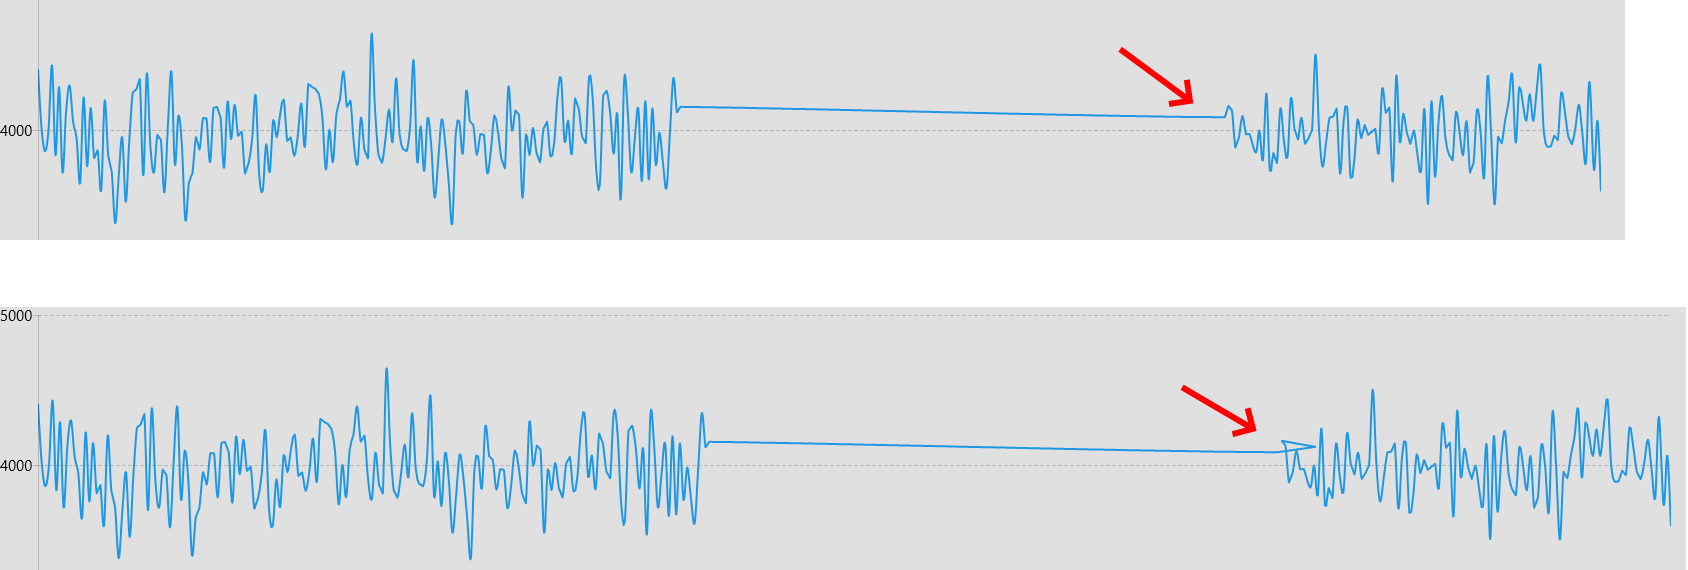
Resizing the window containing a CartesianChart with SplineSeries leads to some incorrect rendering between points:
Unplanned
Last Updated:
02 Jul 2022 06:30
by Sébastien
Created by:
Sébastien
Comments:
0
Category:
Chart
Type:
Bug Report
If we have a Chart with DateTimeContinuousAxis as horizontal axis, updating its Minimum and Maximum values should update the rendered in the Chart plot area data. However, if for some period (Minimum and Maximum range) there is no data, the current displayed data is not cleared.
Unplanned
Last Updated:
17 Jun 2022 08:44
by David
Created by:
David
Comments:
0
Category:
Chart
Type:
Bug Report
If you populate the Chart with data through a SeriesDescriptor as explained here: How to Generate a Dynamic Series Using a Collection of Collections, the PointTemplate/PointTemplateSelector is not applied.
Unplanned
Last Updated:
30 May 2022 08:22
by Sébastien
Created by:
Sébastien
Comments:
0
Category:
Chart
Type:
Bug Report
updating data in real-time causes flickering when series are added through the series provider
Workaround:
Add series to the chart without using the SeriesProvider option.
Workaround:
Add series to the chart without using the SeriesProvider option.