The parameter editors with Available Values are pushed down by the buttons 'clear selection'/'select all'. This makes them misaligned with respect to the parameters without Available Values:

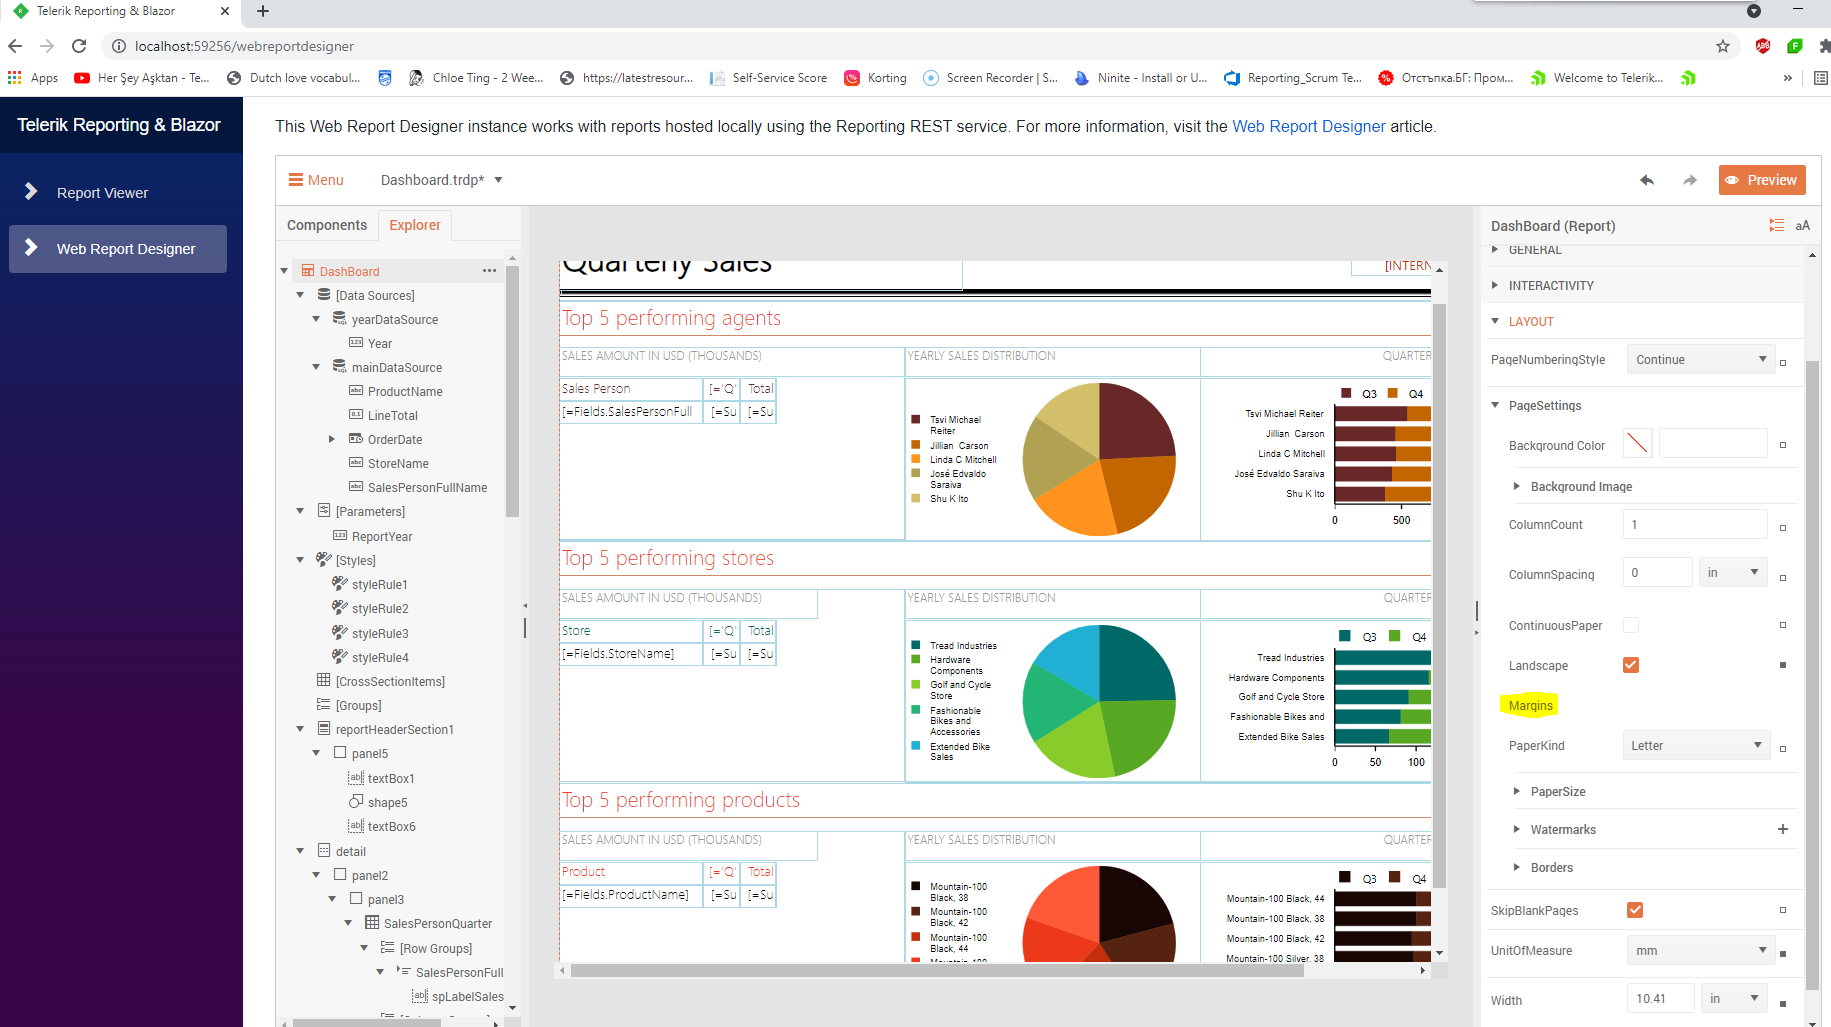
The Margins property cannot be set in the Blazor wrapper of the Web Report Designer:
---------------------------
Telerik Report Designer
---------------------------
Unable to cast COM object of type 'System.__ComObject' to interface type 'mshtml.IHTMLTxtRange'. This operation failed because the QueryInterface call on the COM component for the interface with IID '{3050F220-98B5-11CF-BB82-00AA00BDCE0B}' failed due to the following error: No such interface supported (Exception from HRESULT: 0x80004002 (E_NOINTERFACE)).
---------------------------
OK
When a report is open and the user click on the "generate" button, a busy indicator is displayed and the user can continue to use the application during the generation of the report. The UI thread is not blocked.
But when opening a view with the ReportViewer, the UI freezes during the initial connection to the remote engine, until the report is ready to be generated. If the report has parameters requiring a database query to load the available values, it freezes for a few seconds.
Would it be possible to load the ReportViewer instantly, then display a busy indicator until the report is ready, without blocking the UI thread ? (exactly as for the generation of the report)
DataPointStyle's initial color is displayed as Black but the color is actually Transparent and if I try to set borders between the data points on my graph, they cannot be seen.
Reselecting a color fixes the issue.
I have a Windows Forms application that references a Reports_Library.dll that contains my CLR reports. I want to use the ReportBook in VS, so I followed all of the online tutorials. However, I'm having an issue using the ReportBook.
My Steps:
- Create a new form
- Add a Report Viewer to the form (I don't add any report source to the viewer at this time)
- I add a ReportBook to the form and a dialog box appears with the title of "Report Sources..." I click on "New" and then I click on "Type name". From there I click the drop-down under "Select a Report Type" and there are no options... Usually, when following this procedure with a ReportViewer, there is an option that says <Select Report Document>. I click on that and then choose my document from the Reports Library. However, I don't have the option to do that because the drop-down is blank.
Our manufacturing floor needs to have unprintable characters encoded in the data matrix in our reports, so that our plant controllers can receive instructions. The characters I'm speaking about are things like the Record Separator (ASCII 1E), Group Separator (ASCII 1D), and End of Transmission (ASCII 4).
You can have the three styles in HtmlTextBox. For example:
<strong>bold</strong>, <em>italics</em> , <span style="text-decoration: underline">underling</span>However, if you use expression, for example:
= IIF( Parameters.Parameter1.Value , "<strong>bold</strong>, <em>italics</em> , <span style="text-decoration: underline">underling</span>","some bold text ")Then the expression cannot be evaluated and an error is thrown.
Pasting a HEX value to a report item whose color has not been set before leads to the error:
"An error has occurred. NaN is not a valid value for Int32."
The workaround is to set the color of that property through the ColorPicker control before attempting to paste the new HEX color. If a color has been selected before, the issue is not present.
Currently there appears to be no functionality available to add additional attachments via the Telerik Reporting Send Mail dialog or programmatically by passing parameters to the Report Viewer using a model.
Scenario 1:
- When we email a new Quote, which is a Telerik Report, to a Customer we would like to automatically attach a "New Products Brochure". The brochure is a frequently updated pdf document that would reside on the server.
Scenario 2:
- When we email a Customer Invoice, which is a Telerik Report, to a Customer if:
1) It is the 1st Invoice we have sent them for the current Agreement then automatically attach the Agreement related to Invoice - where the Agreement is another Telerik Report.
2) The Customer has an outstanding balance with us then attach a "Customer Statement", which is another Telerik Report, in pdf format.
Thanks in advance.
When trying to use XML markup as Report Source for a SubReport, the error "Root element is missing" is being thrown.
The input field taking the XML markup seems to initially read only the first row of the XML markup. To work around this issue, expand the input field dropdown and select the <Expression> option then paste the XML markup and save.
Consider the following expression of HtmlTextBox:
= " <span style="text-decoration: underline">hello</span>"
It is evaluated as invalid due to the quotes. However, it works if you replace the inner ones with single quotes:
= " <span style="text-decoration: underline">hello</span>"
Hi admin/team,
we are using HTMLTextBox to display big paragraph text using panel. The paragraph text is having numbered list [Ordered list and Unordered list] content. The report rendering PDF format, the paragrah text has auto corrected number list. We dont want auto corrected number list and should display as we have in paragraph.
Could you please help on this. Do we have any specific properties ? Thanks
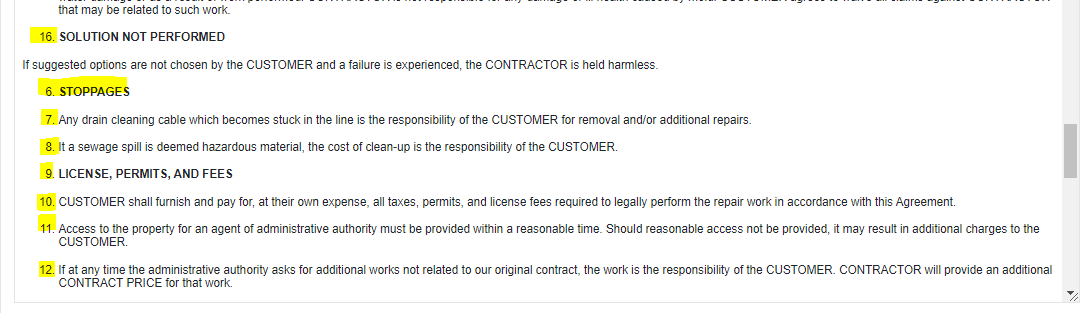
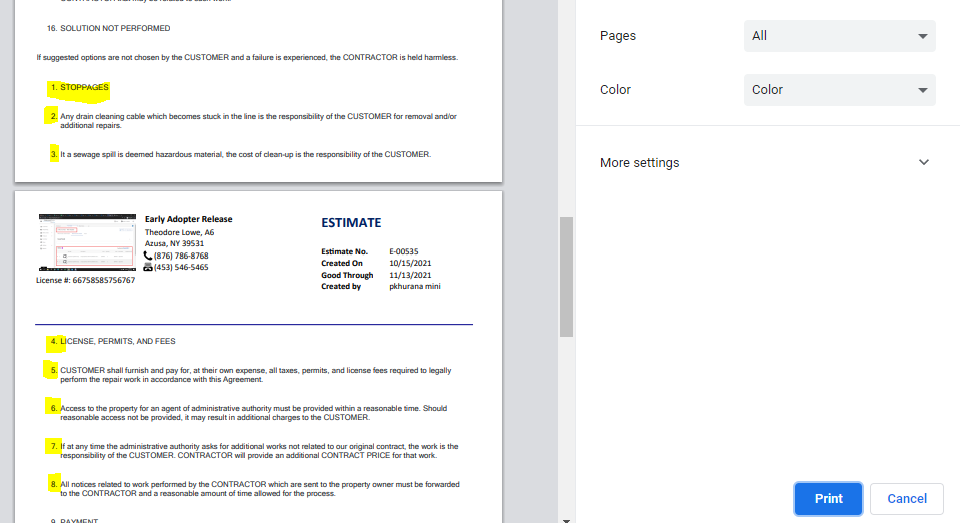
For your reference: Highlighted color -> Expected: some points are start with '6.' numbered list
Actual-> Auto corrected numbered list and start from '1.'
in website Chrome Browser (Expected)
in Report Viewer PDF format(Actual)
OnGetDocument and OnCreateDocument can be overridden in the ASP.NET Web API ReportsController to modify the report documents as explained in the KB Modify exported report document prior to serving it to the viewer client.
In ASP.NET Core this is not possible as OnGetDocument and OnCreateDocument don't exist.
As I outlined in my Issue with the Cross-section Item post to the forums, the current implementation of the cross-section item carries the following limitation:
The Cross-section item uses the report's data context and cannot be evaluated against detail or group data. The processing engine produces a single instance per each Cross-section item in the report definition, therefore its style or visibility cannot be changed based on data fields.
For invoice (or sales order) style reports this places a severe limitation on the complexity of the report.
One of my current projects requires me to create a report layout that can be run for multiple invoices from multiple customers, where each customer has their own unique set of flags that control what information is included on their invoices for each line item of the invoice.
My current version of this report works great when it is run for a single invoice or invoices from a single customer (or from customers who use the exact same set of print flags) by binding the visibility and begin/end margin values of the lines that start in the groupHeader section, cross through the detailSection, before finally terminating in the groupFooter section.
This can be seen clearly in the 2 attached invoices, one with lots of columns of information (called: Invoice with lots of detail columns.png), and another where the customer has been configured with all the additional information toggled off (called: Invoice with minimal detail columns.png).
Unfortunately, because of the cross-section item's current limitation, when I run the report for both invoices the lines attributes/visibility are set based on the customer flags of the "first" invoice in the group, and do not get reset for subsequent invoices. This can be seen in the attached file: Behavior when including both invoices.png.
I understand that if a cross-section item begins/ends in a page/report header/footer, then having it's attributes change based on group-specific data would be less than ideal. But when the line beginning and end points are restricted to a group header and footer, as it always would be for a report layout used for multiple invoices or sales orders, then having that line's attributes change based on the data is the only way to use this functionality for these types of complex reports.
NOTE: While there is a workaround using the attributes/visibility of detail columns, vertical lines in the detail section, and their associated headers and totals textboxes in the groupHeader and groupFooter, it results in an unprofessionial looking report because of the difficulty in getting the variable border and detail vertical lines to line up precisely (and it is very time-consuming to try to implement).
SUMMARY:
Changing the Cross-section item implementation to allow it's data context to be evaluated against detail or group data when the line's terminators are restricted to groupHeader/Footers would allow for its use in more complicated report layouts.
BTW: interally, we refer to these reports as Mighty Morphing Invoice Reports™!!!