The Telerik Reporting REST Service storage is automatically cleaned based on some configurable timeouts and hardcoded times. It requires an awaken service to be performed.
It would be very useful for the developer to be able to invoke manually the storage cleaning functionality either with code or through the service Web API.
1. The design-time preview of the HtmlTextBox throws the "Name cannot begin with the '>' character..." error when the not equal (<>) operator is used in the value expression as it incorrectly tries to parse the operator as HTML markup. The standalone designer does not have a design-time preview for the HtmlTextBox and the issue is not present there.
This does not affect the actual preview of the report and can be worked around by negating the equal (=) operator using the Not operator instead.
2. The design-time preview of the PictureBox throws a null reference exception when it has a binding that changes its value based on one of the fields from the data source. The preview incorrectly tries to respect this binding which will not work in design time as the data is not fetched at this point. Instead, the design-time preview should use the default value from the Value property of the PictureBox, which is what the standalone designer does.
This does not affect the actual report preview.
3. The design-time preview of an HtmlTextBox located in a data item throws a null reference exception when it has a conditional formatting rule that changes the appearance of the HtmlTextBox based on the RowNumber data function. Again, this function cannot be executed successfully during design time as the data is not available yet.
Since this issue is also related to the preview during design time, it does not affect the actual report preview either.
For example, if I set the accent color to be "Navy blue", the quick access toolbar's icons will be pretty much invisible:

The report parameters selection options cannot be navigated through by the keyboard.
The select all and clear selection options can be accessed through the TAB but individual values are not focusable.
The DateTime picker of the DateTime parameters cannot be opened with the keyboard as well.
Inside telerik designer for reports actually if you wish to use an RGBA color, you would need to manually write it.
And generally color choise / picking its a little old style.
-> Would be nice to modernize the UI for color management and implement a COLOR PICKER.
The HTML5 Report Viewer uses inline templates which may require enabling the unsafe-eval CSP policy.
The viewer should migrate to using CSP templates as shown in Getting Started with Content Security Policy (CSP) Templates - Kendo UI Templates - Kendo UI for jQuery.
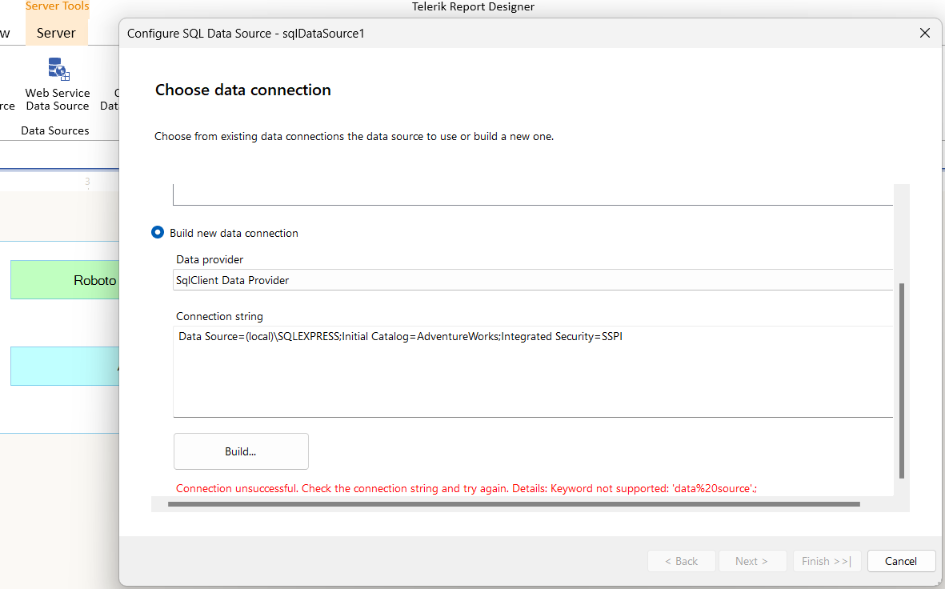
My connection string contains spaces:
Data Source=(local)\SQLEXPRESS;Initial Catalog=AdventureWorks;Integrated Security=SSPI
When I use the functionality 'Build new data connection', the designer throws the following exception:
I use as background color of a TextBox light green (128,255,128). It appears as expected in all renderings except XLS (old Excel 97-2003). In XLS the color is grey (128,128,128).
I observe the same issue when modifying the RGB numbers in some boundaries - the color in XLS is always grey. There are RGB values rendered as expected though.
The issue reproduces with TRDP and CS reports in the corresponding Report Designers.
I have overridden the SendMailMessage method of the ReportsController to implement the email-sending functionality of the web report viewers.
However, despite the method being implemented in my controller, inheriting from the ReportsControllerBase class, the method is never hit, and instead, I get a 501 Not Implemented response.
I'm using Angular 15 LTS
core.mjs:8400 ERROR Error: Uncaught (in promise): TypeError: perspectiveManager.dispose is not a function
TypeError: perspectiveManager.dispose is not a function
at Object.dispose (telerikReportViewer.js:8692:32)
at TelerikReportViewerComponent.ngOnDestroy (telerik-report-viewer.component.js:60:27)
at executeOnDestroys (core.mjs:5976:32)
at cleanUpView (core.mjs:5886:9)
at destroyViewTree (core.mjs:5712:21)
at destroyLView (core.mjs:5864:9)
at RootViewRef.destroy (core.mjs:11804:9)
at ComponentRef.destroy (core.mjs:12226:23)
at RouterOutlet.deactivate (router.mjs:2624:28)
at ActivateRoutes.deactivateRouteAndOutlet (router.mjs:2999:32)
at resolvePromise (zone.js:1255:35)
at resolvePromise (zone.js:1209:21)
at zone.js:1322:21
at _ZoneDelegate.invokeTask (zone.js:450:35)
at Object.onInvokeTask (core.mjs:24197:33)
at _ZoneDelegate.invokeTask (zone.js:449:64)
at Zone.runTask (zone.js:218:51)
at drainMicroTaskQueue (zone.js:639:39)
at ZoneTask.invokeTask [as invoke] (zone.js:536:25)
at invokeTask (zone.js:1710:22)
This needs to be fixed ASAP, it's causing isues when the report page is being destroyed.
Hello,
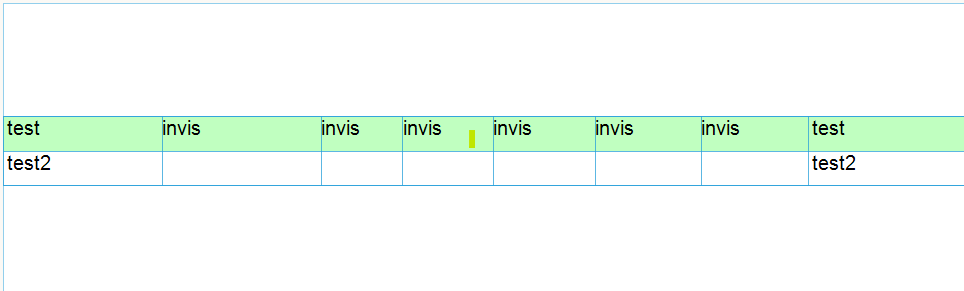
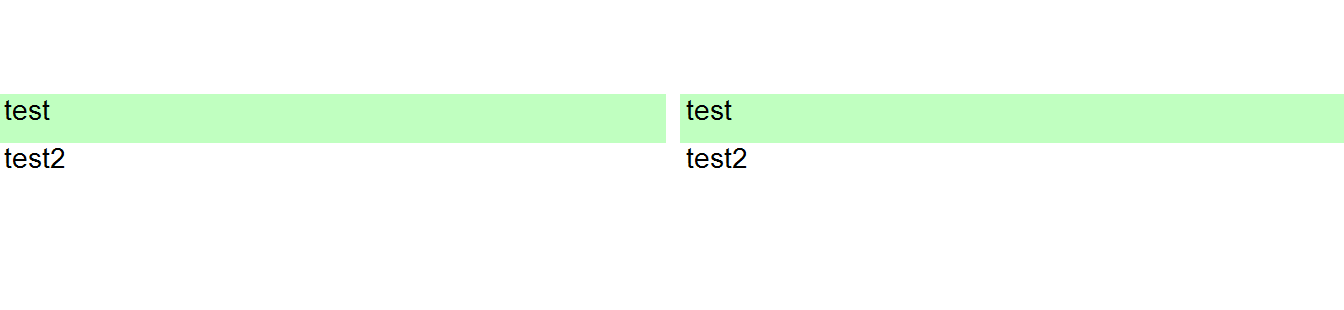
when i set Visible=false for some columns in a table, there is a white space between this columns.
How can i prevent that?
Designer (Standalone):
Preview:
Thanks in advance
Reproducible in version: 18.2.24.924 +
Not reproducible in version: 18.2.24.806
Description
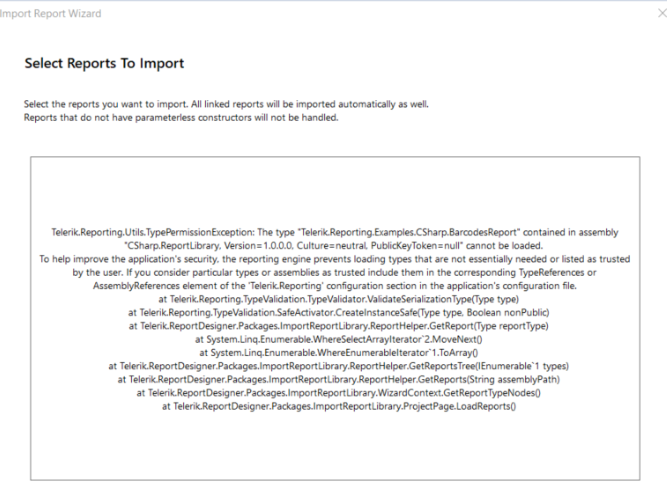
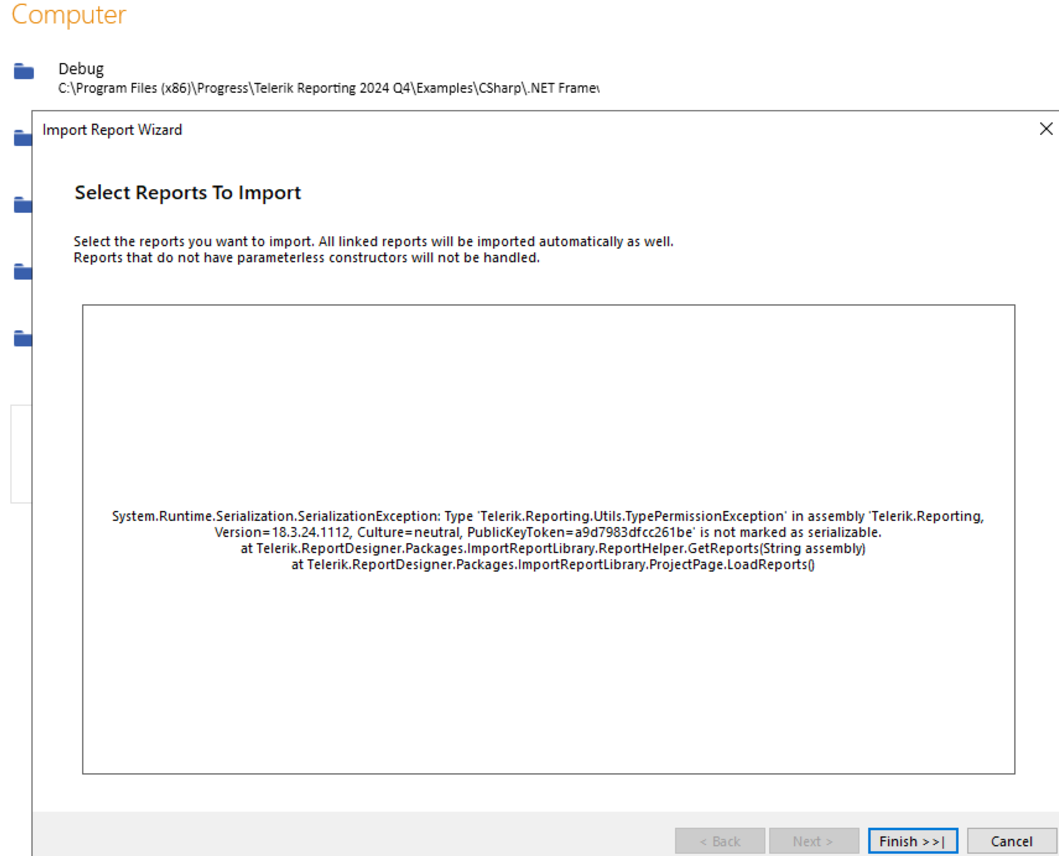
In releases before 18.2.24.924 it was enough to open dll with types from SRD in order to be able to import the type reports. Currently, this is possible only if you copy the dll next to SRD exe file and add entry in Assembly References for the dll.
Steps To Reproduce
Build the project CSharp.ReportLibrary.csproj in C:\Program Files (x86)\Progress\Telerik Reporting 2024 Q4\Examples\CSharp.NET Framework\ReportLibrary
Start SRD FF and from Open menu select the CSharp.ReportLibrary.dll dll in C:\Program Files (x86)\Progress\Telerik Reporting 2024 Q4\Examples\CSharp.NET Framework\ReportLibrary\bin\Debug
Expected behavior
Something like "Please add first Assembly reference to the dll... from ...". Or even better. Do you allow the assembly ... to be loaded? And we can add the assembly reference instead of the customer.
Actual behavior
TypeReference error.
The ReportsControllerBase is returning a JSON payload of { "InstanceId": "xxxx" } instead of { "instanceId": "xxxx" } that the Html5 ReportViewer is expecting. I believe the CreateInstance method should be using CreateJsonResponse instead of CreateResponse. I overrode the ReportsControllerBase.CreateInstance like the following to get it working again:
response = base.CreateInstance(clientId, reportSource);

// This is to work around a bug in telerik reporting.
BusinessLogicResponse v = BusinessLogicResponse.CreateInstance(HttpStatusCode.Created, ((ObjectResult)response).Value);
response = base.CreateJsonResponse(v);
Hi, in the wpf report viewer, the date picker in the parameter's zone don't have a "Today's date button". The standalone report designer have the "Today's date button".
Date picker of the report designer :
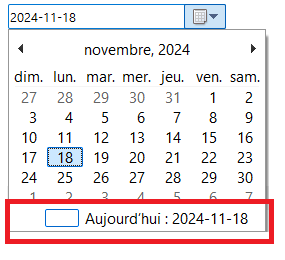
Date picker of the wpf report viewer :
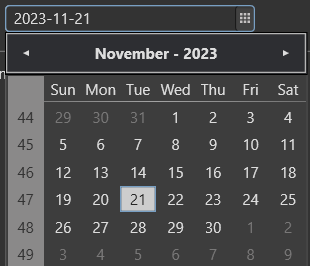
Is it possible please to add the "Today's date button" for date pickers in the wpf report viewer?
Thanks a lot!
Even though I set "parametersAreaVisible" to false, the parameter area is still visible. A bit of tweaking.
Let me make a change request in the telerikReportViewer-18.3.24.1112.js file:
function showParametersAreaIfNecessary(params) {
            parametersAreaNecessary = hasVisibleParameters(params) || !controller.isReportAutoRun();
            showParametersArea(parametersAreaVisible && parametersAreaNecessary);
        }