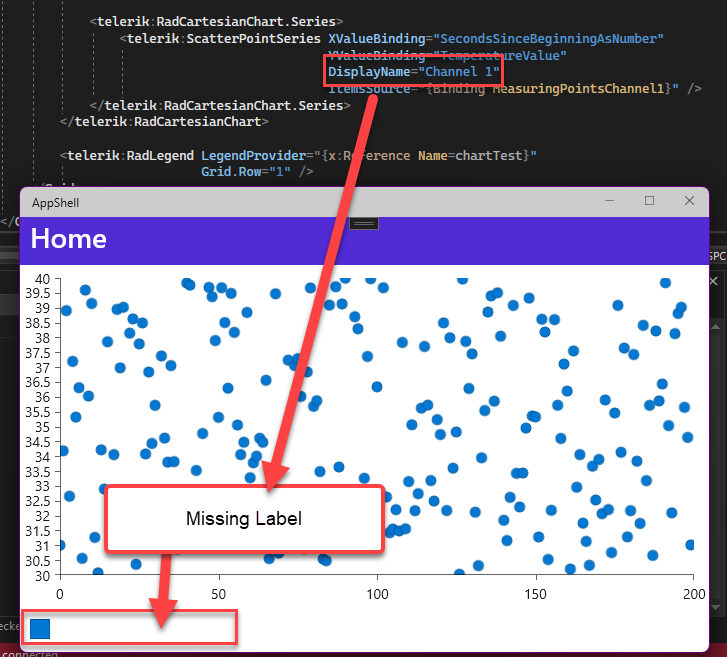
Unplanned
Last Updated: 30 Jun 2023 09:54 by Steve
When setting the Stroke of the ScatterLineSeries to something other than the default, the RadLegend icon color does does not sync to match.
 
Unplanned
Last Updated: 19 Apr 2023 11:48 by Anne
Created by: Anne
Comments: 0
Category: Chart
Type: Feature Request
2
I want to set textcolor to the text inside the trackball and apply background color to it. 
Completed
Last Updated: 15 Mar 2023 12:20 by ADMIN
Release 5.1.0

I have a RadPieChart in my application. When removing the app from the backstack and service is running, then opening the app from the notification, the app crashes with: 


Java.Lang.IllegalStateException: ChildNode is already parented by a ChartElement instance.


Completed
Last Updated: 15 Mar 2023 11:31 by ADMIN
Release 5.1.0

When adding a plot band annotation to the date time axis, it is not applied on MacCatalyst and iOS. In addition if using binding, an exception is thrown.  

System.ArgumentNullException: Value cannot be null.
Parameter name: minimum
  at TelerikUI.TKRange..ctor (Foundation.NSObject minimum, Foundation.NSObject maximum) 


It works on Android and WinUI

Completed
Last Updated: 15 Mar 2023 11:30 by ADMIN
Release 5.1.0
When using DateTimeAxis and the chart data points use milliseconds, the axis does not display the milliseconds correctly. 
Completed
Last Updated: 15 Mar 2023 11:30 by ADMIN
Release 5.1.0

An exception is thrown when setting the ChartPallete FillColor property. The issue is reproduced on all platforms.

Workaround:

Also set the StrokeColor property.

<telerik:ChartPalette>
    <telerik:ChartPalette.Entries>
        <telerik:PaletteEntry FillColor="Red" StrokeColor ="Yellow"/>
        <telerik:PaletteEntry FillColor="Gray" StrokeColor ="Yellow" />
        <telerik:PaletteEntry FillColor="Blue" StrokeColor ="Yellow"/>
    </telerik:ChartPalette.Entries>
</telerik:ChartPalette>


Unplanned
Last Updated: 02 Mar 2023 15:10 by Daniel
Add support for reordering the series in the PieChart.
Unplanned
Last Updated: 02 Mar 2023 15:06 by Daniel
PieChart should provide customization properties for its Series Labels like FontSize, FontAttributes, property for LabelPosition, FontFamily, TextColor, etc.
Unplanned
Last Updated: 02 Mar 2023 15:02 by Daniel
Created by: Daniel
Comments: 0
Category: Chart
Type: Feature Request
2
Add support for selecting a slice of the PieChart from the code - behind.
Unplanned
Last Updated: 20 Jan 2023 16:05 by John
Created by: John
Comments: 0
Category: Chart
Type: Feature Request
1

Hi team,

Currently, I can only set LegendItemFontColor and LegendItemFontSize. I would like to be able to set LegendItemFontFamily

Thank you,

John

Unplanned
Last Updated: 20 Jan 2023 16:00 by John
Created by: John
Comments: 0
Category: Chart
Type: Feature Request
1

Hi Team,

I would like to be able to set different cap styles on the bars, like the RadGauge allows you to do on Indicators. For example, I want rounded corners.

Thank you,

John

Unplanned
Last Updated: 02 Jan 2023 09:44 by Sebastian

On some chart series like, bar, line, scatter line, etc, the y axis line is hidden. make it visible, as it is on Android and Windows. 

Current solution is to use the chart handler changed and set YAxis.Style.LineHidden to false.

public partial class MainPage : ContentPage
{
    public MainPage()
    {
        InitializeComponent();

        this.chart.HandlerChanged += this.Chart_HandlerChanged;
    }

    private void Chart_HandlerChanged(object sender, EventArgs e)
    {
        this.UpdateChart();
    }

    private void UpdateChart()
    {
        var platformView = this.chart.Handler.PlatformView;
#if IOS || MACCATALYST
        var platformChart = (Telerik.Maui.Controls.Compatibility.ChartRenderer.iOS.TKExtendedChart)platformView;
platformChart.YAxis.Style.LineHidden = false;
#endif
    }
}

Unplanned
Last Updated: 21 Dec 2022 10:39 by Dustin
Created by: Angus
Comments: 1
Category: Chart
Type: Feature Request
2
I need to show multiple series in the graph controlled by some other switch / check box list that selects which series to show on the graph.
Unplanned
Last Updated: 05 Dec 2022 15:23 by Clint
Created by: Clint
Comments: 0
Category: Chart
Type: Feature Request
4
Add a title for the horizontal and vertical axis.
Unplanned
Last Updated: 07 Oct 2022 08:49 by Angus
Created by: Angus
Comments: 2
Category: Chart
Type: Feature Request
1

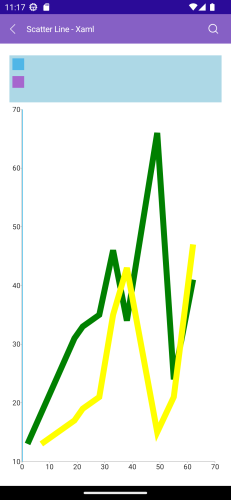
I would like to use line style instead of colour to distinguish between the different series on my chart as below. 

Is this possible?

From the docs it looks like we can only customise stroke colour and thickness. 

Thanks =)

Unplanned
Last Updated: 07 Oct 2022 08:47 by Angus
Created by: Angus
Comments: 1
Category: Chart
Type: Feature Request
1


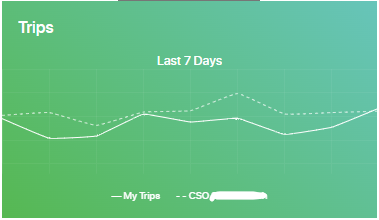
Can the Legend be identical to the LineSeries, not only by colour, but also by style?

Unplanned
Last Updated: 05 Sep 2022 13:17 by Sergio
Created by: Sergio
Comments: 0
Category: Chart
Type: Feature Request
5

Can I customize the text inside the bar?

- Text Color, Position, FontSize, etc.

Unplanned
Last Updated: 24 Aug 2022 14:19 by Valliappan
Created by: Valliappan
Comments: 0
Category: Chart
Type: Feature Request
2
Currently the legend icon is displayed as square. Provide an option to change it to circle for example. 
Unplanned
Last Updated: 13 Jul 2022 12:53 by ADMIN

I just made a little test application using the .NET 6 Preview 6 and MAUI with chart control to see if we can use it for a future project. I was able to display just a basic chart with 1000 points in it, in ascending order on X axis. But the performance is really not there when running on my Android 10 device. I only made a Zoom at factor 2 and use panning right to left and it's not smooth at all. There is nothing in the chart (no grid, no annotations). Just a simple 2 axis chart. I can really not go with this because there will be many more data in our product at the chart need to be fast enough. Maybe it's a settings somewhere that need to be adjusted... Take a note that I was able to run the chart in WinUI project and the performance is correct, but I am on a very fast PC, it is just normal to be fast. Note: There is some kind of deceleration effect when panning, I want to disable it but not found how.

Anyway, it will be really cool if you can provide a very simple MAUI test application with the fastest full screen chart with Pan/Zoom with 1000 points (which for me is really not much data) and the corresponding code to me to validate if your library can do the job. I know that MAUI and .NET 6 is not released yet, but performance should be there now because it's really close to bug fixing only state now. Thanks.

Completed
Last Updated: 13 Jul 2022 10:37 by ADMIN
Release Release 2.1.0
On iOS, when using the TrackBall behavior, if the graph is zoomed at all when trying to move side to side it scrolls the graph rather than moving the line/info box.