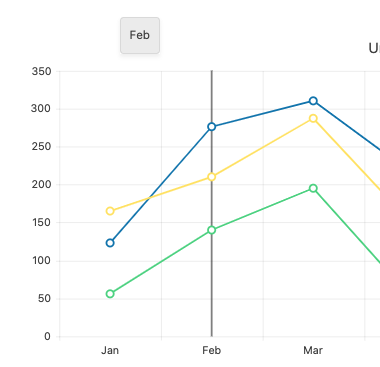
Describe the bug
When we have a Chart Tooltip in the Native Vue Chart and this Tooltip appears over the Chart itself, if we hover the Tooltip it starts to flicker.
To Reproduce
- Open this StackBlitz example
- Hover random series to display the ToolTip
- Move the mouse cursor over the ToolTip
Expected behavior
The Tooltip of the Native Chart should not flicker when moving the mouse cursor over it.
- Possible workaround is to use the following CSS definition:
.k-animation-container.k-chart-tooltip-wrapper {
  pointer-events: none;
}
Describe the bug
The initial animation of the Donut Chart is not playing consistently when updating the Chart's value.
- The issue is replicable on Chrome and the animation works correctly on Firefox
To Reproduce
- Open this StackBlitz example in Chrome
- Watch the Chart for a while. In a certain period, the Chart will immediately be rendered without animation.
Expected behavior
The Chart should be rendered with animation every time its data is updated.
Screenshots
DonutChart.mov
The current implementation of the Native Chart component doesn't provide the option to define the position of the tooltip when using crosshairs in the component.
Can you add a configuration option similar to categoryAxis.crosshair.tooltip.positionwhich is available in the jQuery suite?
Describe the bug
When configuring the Chart to have a Crosshairs the Tooltip that appears is not centered as it is in the other Kendo UI suites.
To Reproduce
- Open this CodeSandbox example
- Hover a randomly selected element in the Chart
Expected behavior
The Tooltip that appears above the vertical crosshair should be centered above the line
Currently, if we want to set the height of a Pie Chart, its labels are appearing outside the visible area of the component. This behavior can be seen in this StackBlitz example.
While the Kendo UI for Angular and Kendo UI for jQuery have the autoFit property available in the seriesItems' configuration, this property is missing in the Native Vue Charts. making this property available in the Vue Charts will help in the implementation of specific Chart scenarios.
Describe the bug
The Bar Chart component renders only one column no matter the number of series passed to it. The Bar Chart renders only the first seriesitem passed to it
To Reproduce
- Open this Dojo example and run it
Expected behavior
There should be two columns rendered for each category as in this StackBlitz example.
Describe the bug
In a scenario where we want to display a Date in the Chart category, the Native Chart doesn't work when we use the ISO Date format
If we take the same project and use Date data like:
- '2021-05-21' - everything is working correctly
- '2021-05-21T11:21:50Z' - the execution of the project is blocked
Here is a working example with the first data type.
To Reproduce
- Open this example. It is the same as the working one provided above but with Date data in ISO format
- Run the project
Expected behavior
The Native Chart should be working correctly both with the non-ISO and ISO formatted data.
Describe the bug
The data inside the Chart is not updating when we change the data it is bound to.
To Reproduce
Steps to reproduce the behavior:
- Download this project(_re-render.zip) and install the NPM packages(run: npm i)
- Start the project(run: npm run serve)
- Click on the "Change dataset" button
Expected behavior
With each click of the "Change dataset" button, the "Duration" property of the first element inside the "projects" array is being changed. With this change of "Duration", the Chart should be updated.
Currently, the Chart component can be exported to PDF, Image or SVG file.
Being able to export Charts to an Excel file would be a useful feature. The exported file should contain the Chart data and visualize the Chart itself.
The issue is reported in ticket - https://supportheroes.telerik.com/ticket/1547173 and there is a project attached and the warning is this one:


