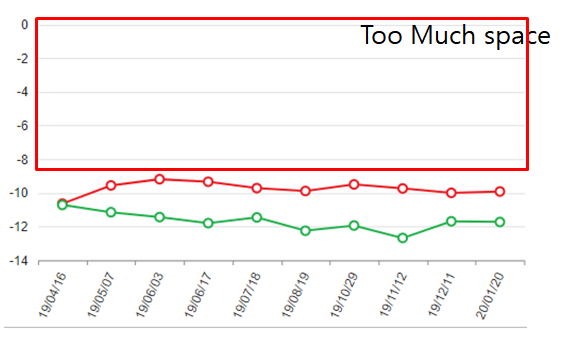
When the data values are all negative, if you create a line graph using kendo chart function, Autoscale on the Y axis is not applied properly. Please check if there is any possible solution.
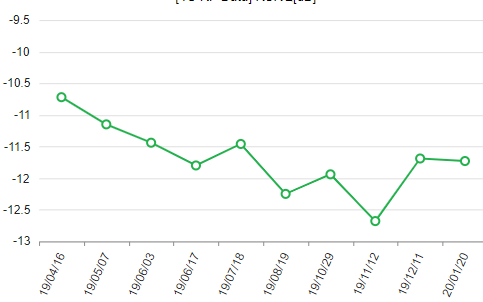
The two attached figures are normally auto scaled, but the charts that combine the two graphs are not auotoscale normal.
Chart1
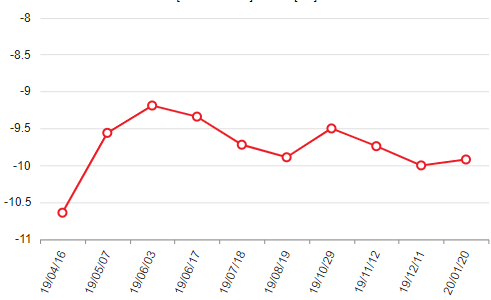
Chart2
issue chart
Pie chart labels are not properly rendered when exported to image.
The issue can be reproduced here:
outliers: [0,0,0.5,6,7,11]I.e. For the list of outliers above, I'd like to have all even outliers green and odd outliers red.
Green: 0, 0, 6
Red: 0.5, 7, 11
There are a few bits that Telerik cant do at the moment, such as colour above the target line.
It would be nice to have a how-to section on migration and development.
Thanks
Doug
Hi,
When creating a stacked bar chart in KendoUI 2020.3.915 I noticed the following rendering error:
In case one of the categories is much higher than the other, the x-axis will start at a value other than zero.
This behavior might be desired to zoom in on the exact values.
The issue here is that the steps on the x-axis might repeat multiple times for the same x-value.
(96%, 96%, 97%, 97%, 98%, 98%...)
This increases with a bigger difference between the chart values.
I created a example and it happens even in the latest version:
https://dojo.telerik.com/AVeVuZig
Bug report
ValueAxis.labels.template function invokes twice when Chart is bound to data source
Reproduction of the problem
Check the following Dojo: https://dojo.telerik.com/oJUGixUy/4
Inspect the console
Expected/desired behavior
ValueAxis labels template function shall invoke just one time.
Corner case:
If ValueAxis.labels.font is specified template function is invoked correctly only once.
valueAxis: {
                labels: {
                  // With the font commented out, chart labels get resolved twice
                  font: '11px Arial, Helvetica, sans-serif',
                  template: shortLabels
                }
              },
Environment
**Kendo UI version: [all]
**jQuery version: [all]
**Browser: [all]
We are using asp mvc, but the but it is completely reproduceable with only jquery as shown in the file attached.
When using a scatter chart with a date axis any zooming with the mouse wheel will crash most if not all browsers.
At the very least current versions of chrome (97.0.4692.99), firefox (96.0.1) and edge (97.0.1072.62).
The problem can be seen in the following Dojo:
https://dojo.telerik.com/uQeduJAG
When the Donut Chart has a section with value = 0, the color of that point is displayed inside the donut.
Hi Team,
I would like to request the Bar/Column charts to be able to be configured with a Target Line similar to the bullet charts.
Thank you!
The Kendo Chart supports the baseUnit: "fit" property that displays as many categories as possible. This is useful when there are thousands of data points across many years.
When the data is "fit", the last date may not be displayed(because of the aggregation). I want to have the ability to display the last data point and date(category) as standalone and not a part of the aggregate.
Bug report
When the user tries to zoom the Chart and a zero range is selected, an error (Uncaught TypeError: Cannot read properties of undefined (reading 'min')) is thrown in the browsers console.
Reproduction of the problem
- Open the Dojo - https://dojo.telerik.com/@NeliKondova/eQiKUqOB
- Press the
Shiftkey and select a range. Try the min and max of the range to be almost the same.
Current behavior
Uncaught TypeError: Cannot read properties of undefined (reading 'min') error is thrown in the console.
screencast - https://somup.com/c06lloBaw2
Expected/desired behavior
There should be no error in the browsers console, no matter of the selected range.
Environment
- Kendo UI version: 2023.3.1010
- Browser: [all ]
Bug report
Chart with log valueAxis allows to deem zoom and throws an error: Uncaught Error: Non positive values cannot be used for a logarithmic axis
Reproduction of the problem
Dojo: https://dojo.telerik.com/OCuziYOr
Expected/desired behavior
The Chart shall not allow this deep zoom
Environment
Kendo UI version:[all]
Browser: [all ]
I need that the point will be in the start of chart (like justified property behavior) and the line style of "rangeArea" type property will be "step".
In this example the point in the start and the justified property works as expected.
https://dojo.telerik.com/IZuXOyAZ
but in the second example, when I added property: line: {style: "step"} to "rangeArea" type, the point start in the middle of labels, and justified property not working.
https://dojo.telerik.com/ILOxehAB/3
So I need that my chart will be like the second example, but the start point of the line will be like the first example.
Bug report
Setting the visibility using the toggleVisibility method in the legendItemHover event leads to legendItemHover being triggered multiple times. Thus, the legendItemLeave method is never called.
Reproduction of the problem
- Open the Dojo example - https://dojo.telerik.com/@NeliKondova/UVIVaBoH
- Hover the legend
Current behavior
If you try to move the cursor slightly the legendItemHover event is fired multiple times and the legendItemLeave event is never called.
Expected/desired behavior
The legendItemHover should be fired a single time when the mouse enters the legend and also the legendItemLeave should be fired even if the visibility of the legend is set through the toggleVisibility method.
Workaround - Check for visible/not visible series in the series._options
function onLegendItemHover(e){
        e.preventDefault();
        console.log("Hover");
        let chart = e.sender;
        let seriesIndex = e.seriesIndex;

        for(let i = 0; i < chart.options.series.length; i++){
          if(i !== seriesIndex){
            let series = chart.findSeriesByIndex(i);
            if (series._options.visible) {
	            chart.findSeriesByIndex(i).toggleVisibility(false);
            }
          }
        }
      }

      function onLegendItemLeave(e){
        e.preventDefault();
        let chart = e.sender;
        console.log("Leave");
        for(let i = 0; i < chart.options.series.length; i++){
          let series = chart.findSeriesByIndex(i);
          if (!series._options.visible) {
            chart.findSeriesByIndex(i).toggleVisibility(true);
          }
        }
      }
Dojo with workaround - https://dojo.telerik.com/@NeliKondova/EpOYadid
Environment
- Kendo UI version: 2023.3.1114
- Browser: [all ]
Bug Report
When the zIndex is set the the chart marker in the legend is misaligned.
Reproduction of the problem
- Open the Dojo - https://dojo.telerik.com/@NeliK/OCEtoRuz
Current behavior
The line and the marker in the legend are misaligned.

Expected/desired behavior
The line and the marker should be aligned even when the zindex is set.

Environment
- Kendo UI version: 2024.1.319
- Browser: [all ]
In Excel, there is an option for Sparkline to set a marker for the highest point, lowest point, first point, last point, and negative point.
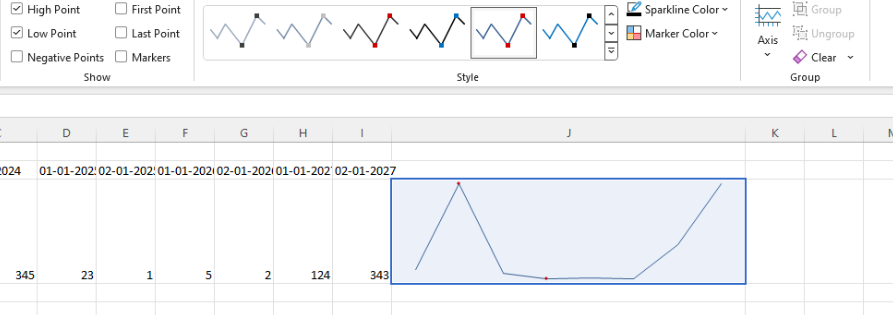
I know that it is possible to customize the appearance of the markers using the markers.visual. However, I would like to have the option as a built-in configuration to ensure better performance.
Dear support team,
we are facing an issue when trying to use "setOptions" to update a Chart.
It works fine when using a normal bar chart but seems to be broken when using stacked bars:
https://dojo.telerik.com/AKEWaLIR
Are we doing something wrong or is this a bug?
Bug Report
The diagram.exportImage() throws an error with v.2024.4.1112
"Uncaught TypeError: diagram.exportImage(...).done is not a function"
Regression with 2024.4.1112.
Reproduction of the problem
Run the example from the following API: https://docs.telerik.com/kendo-ui/api/javascript/dataviz/ui/diagram/methods/exportimage
Current behavior
The export is not working.
Expected behavior
No error shall be present and image must be generated.
Environment
Kendo UI version: 2024.4.1112
jQuery version: x.y
Browser: [all]