Description
When you move the cursor to a new series item, the tooltip position does not move until you leave the chart area and re-enter. It changes the content based on where the cursor is pointing, but does not change the position.
Steps To Reproduce
- Create a new Angular application
- Add the Kendo UI Chart and paste the following code in the app.component.ts file:
import { Component } from '@angular/core';
import {KENDO_CHARTS} from "@progress/kendo-angular-charts";

@Component({
  selector: 'app-root',
  imports: [KENDO_CHARTS],
  template: `
    <kendo-chart>
      <kendo-chart-legend position="bottom"></kendo-chart-legend>
      <kendo-chart-series>
        <kendo-chart-series-item
          type="donut"
          [data]="data"
          field="value"
          categoryField="category"
          colorField="color"
          [holeSize]="60"
          [tooltip]="{
            visible: true,
            format: '{0:C0}'
          }"
          [highlight]="{ visible: true }"
        >
        </kendo-chart-series-item>
      </kendo-chart-series>
    </kendo-chart>
`,
})
export class App {
  public data = [
    { category: "Electronics", value: 245000, color: "#0058e9" },
    { category: "Clothing", value: 189000, color: "#37b400" },
    { category: "Home & Garden", value: 156000, color: "#f59c1a" },
    { category: "Sports", value: 134000, color: "#ff6358" },
    { category: "Books", value: 98000, color: "#8c43ff" },
    { category: "Toys", value: 78000, color: "#00acc1" },
  ];
}
- Run the application
Screenshots or video

Actual Behavior
The Tooltip position only changes when you leave and reenter the Chart area. It does not change when you move the cursor from one series item to other, it updates the content displayed in the Tooltip though.
Expected Behavior
The Tooltip position should move with the cursor as seen in the screen recording below:
Hello ,
Kindly Have issue with stacked bar when try to draw two items in chart with specified with as the below
<kendo-chart-series>
  <kendo-chart-series-item type="bar" [stack]="{ type: '100%' }" [data]="[97]">
  </kendo-chart-series-item>
  <kendo-chart-series-item type="bar" [stack]="{ type: '100%' }" [data]="[7]">
  </kendo-chart-series-item>
</kendo-chart-series>
Can Anyone help on that ?
We have this feature in Kendo Grid:
<ng-template kendoGridNoRecordsTemplate>
  <fa-icon [icon]="faCloudXmark" class="fa-2x"></fa-icon>
  <p>There is no data to display.</p>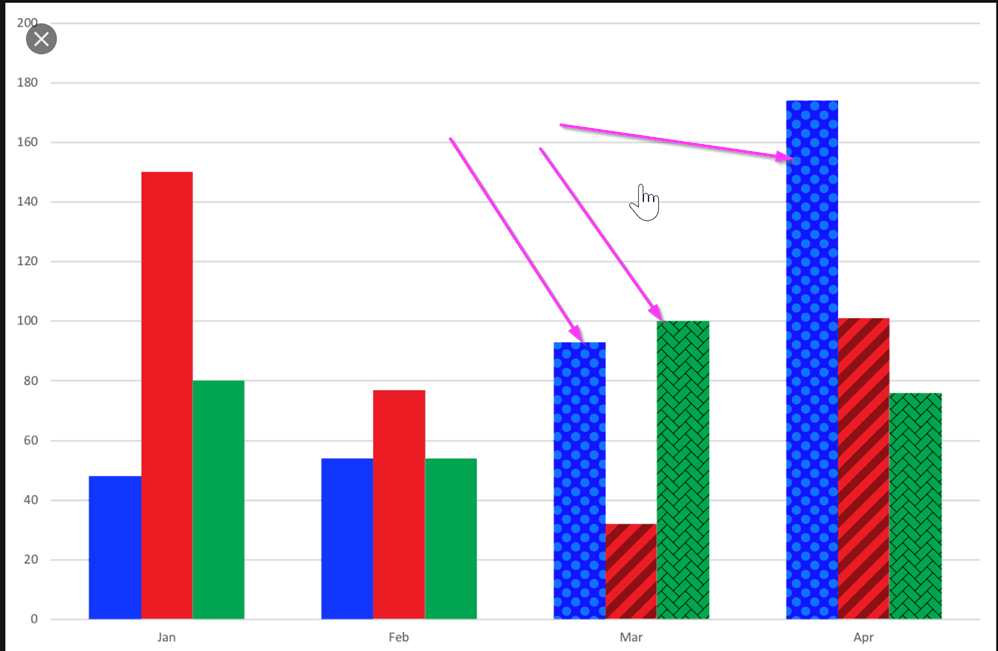
</ng-template>I would like to be able to use a texture, a pattern, or an image as the background of a Kendo chart.
One use-case where this would come handy is a stacked bar chart where all segments of the bar have the same color. A way to visually separate them could be via different textures.
See image below for an example reference:
Describe the bug
The <kendo-chart-series-item> component is missing settings for median and mean elements rendered by Box Plot series.
These are the two lines within each box (dashed line is mean):
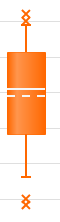
Expected behavior
These series elements should be customizable and should accept an object containing color, width, dashType and opacity.
Request to allow control of SVG dimensions from exportSVG options
Ideal behavior:
export class AppComponent {
this should produce a 600x300 svg. ChartComponent.prototype.exportSVG does not pass options into ChartComponent.prototype.exportVisual in the kendo-angular-charts library. I request that it pass these options in to allow for SVG dimension specification. I have modified the code manually and it behaves as expected.
For our line chart it would help a lot to be able to display the date (category) along with the value when the user hovers over with the mouse.

If dataItem was added to ChartSeriesTooltipTemplate then that would allow full flexibility, which would be nice.

http://www.telerik.com/kendo-angular-ui/components/charts/api/TooltipComponent/#toc-format

http://www.telerik.com/kendo-angular-ui/components/charts/api/SeriesTooltipTemplateDirective/