Hello,
It seams that Milliseconds are missing from ChartAxisLabelsDateFormats and so there is no Milliseconds(string format) in ChartAxisLabelsDateFormatsBuilder.
https://docs.telerik.com/aspnet-mvc/api/kendo.mvc.ui.fluent/chartaxislabelsdateformatsbuilder
This means that to configure it, we have to config it from client js on load
Note: My current version is 2022.2.621 but according to doc it's the same in 2024.3.1015
### Bug report
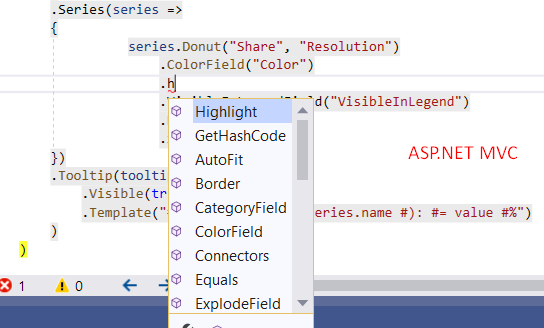
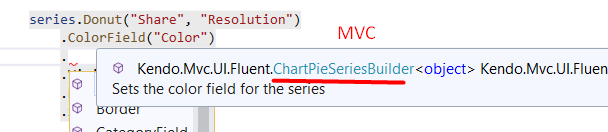
The legend items cannot be configured in the SeriesDefaults() configuration of the Pie Chart.
### Reproduction of the problem
1) Create a Pie Chart with a visible legend.
2) Add the SeriesDefaults() configuration and try to add the LegendItem() option to set the type of the legend items.
.SeriesDefaults(seriesDefaults =>
{
    seriesDefaults
            .Pie();
            .LegendItem(x => x
                .Type("line")
                .Line(y => y.DashType(ChartDashType.Solid)));
})
The Legenditem() option is available for Telerik UI for ASP.NET Core Pie Chart.
### Expected/desired behavior
The legend items of the Pie Chart must be configurable through the SeriesDefaults() option.
### Environment
* **Telerik UI for ASP.NET MVC version: 2024.1.319
* **Browser: [all]
The date aggregation has ChartSeriesAggregate.First however it would be useful to also have ChartSeriesAggregate.Last iei aggregating share price.
Is there currently anyway to implement?
 @(Html.Kendo().Chart(Model)
        .Name("chart")
        .Series(series =>
            {
                series
                    .Column(model => model.Value, categoryExpression: model => model.Date)
                .Aggregate(ChartSeriesAggregate.Avg);
        })
        .CategoryAxis(axis => axis
            .Date()
            .BaseUnit(ChartAxisBaseUnit.Weeks)
            .MajorGridLines(lines => lines.Visible(false))
        )
        .ValueAxis(axis => axis
            .Numeric()
            .Line(line => line.Visible(false))
        )
    )
Using Kendo through MVC creation. Create any chart with @(Html.Kendo().Chart()) code. Plug in a color into any property: Font.Color, MajorGridLines.Color, Series.Color (line, area, column), ValueAxis.Color etc. The color should be a hex string in the format of #102030. The pound character in here messes up the ToClientTemplate() method or alternatively the parsing of that finished template back on the Kendo scripts.
A workaround is to instead use rgb(16, 32, 48) since the # character is not there.
For now I added this extension method if it helps anyone who stumbles along to this.
public static string ToRgbColor(this string hexColor) {
   var color = ColorTranslator.FromHtml(hexColor);
   if (color.A == 255) {
      return $"rgb({color.R},{color.G},{color.B})";
   }
   else {
      return $"rgba({color.A},{color.R},{color.G},{color.B})";
   }
}
The method is not available for the MVC wrappers but it is available for ASP.NET Core.
It would be nice to be able to configure the stock chart's navigation pane the same way that regular charts are configured. Options for multiple vertical axes, axis-crossing-values, label templates, chart types (line, area, column), and any other configuration options that standard charts/sparklines would have.
Hello,
I noticed that the date format from my current kendo culture (fr-FR) is not applied properly for Weeks and Days units on xAxis labels of a chart with date axis.
I had to set the property DateFormats for Weeks and Days of my XAxis Labels to force the format (other units work fine) :
@(Html.Kendo.Chart(Of Models.DataViewModel).
        Name("chart").
        Title(typeMesure.GetDescription()).
        DataSource(Sub(dataSource)
                       dataSource.Read(Sub(read)
                                           read.Type(HttpVerbs.Get).Action("GetData","Data"))
                                       End Sub).
                                       Sort(Sub(sort) sort.Add(Function(m) m.Dt).Ascending())
                   End Sub).
                            Series(Sub(series) series.
                                        ScatterLine(Function(m) m.Dt, Function(m) m.Value).
                                        Markers(False).
                                        MissingValues(ChartScatterLineMissingValues.Gap).
                                        Color("#cb1d39").
                                        Tooltip(Sub(tooltip)
                                                    tooltip.Visible(True).
                                                    Template("Date : #= kendo.toString(value.x, 'dd/MM/yyyy HH:mm') # <br/>Valeur : #= kendo.toString(value.y, 'n3') #")
                                                End Sub)).
                            XAxis(Sub(xAxis) xAxis.Date().
                                        Min(Model.DateDebut).
                                        Max(Model.DateFin).
                                        Labels(Sub(labels) labels.DateFormats(Sub(dateFormats) dateFormats.Weeks("dd/MM").Days("dd/MM")))).
                            Panes(Sub(panes) panes.Add().Clip(False)).
                            Pannable(True).
                            Zoomable(Sub(zoomable)
                                         zoomable.Mousewheel(Sub(mousewheel) mousewheel.Lock(ChartAxisLock.Y)).
                                         Selection(Sub(selection) selection.Lock(ChartAxisLock.Y))
                                     End Sub))
Could you please fix this issue in a future version ?
Thanks and regards.
Background:
In our project, there's a newly revamped application and Kendo UI has been used for first time.
The Home page of our application has a bar graph and a donut graph.
I am from Test Automation team and run OpenTest-Selenium tests on Chrome and IE browsers.
The problem described below applies to both, so to keep it simple I will describe for only the bar graph.
Reference isolated application:
https://demos.telerik.com/kendo-ui/bar-charts/column
Problem Description Title: UI based automated tests run on Chrome succeed, but fail on IE for Kendo Bar Chart
Troubleshooting performed: In both browsers, we looked for the click event using the Browser Inspector
Observation: The click event is present in Chrome, but not in IE
I found an article in your site:
https://docs.telerik.com/kendo-ui/controls/data-management/grid/performance#using-fast-browsers
Is this the reason that you've no exposed this event specifically in IE?
(My understanding from this is that the Click event can be exposed, but is currently not done in the interest of performance).
Could you share any data on what is the slowness with how much data, so I could share it with our Dev team.
Because the number of bars in our application is only 4 (always) and volume of data gets reflected in the height of the bars.
Thanks,
Sudipto.
Hello,
Like a lot of companies we have multiple client side interfaces of a single application and have to create similar UI in multiple platforms.
For example I had to create a chart in both WPF and ASP.NET AJAX today.
The problem I have with the Telerik controls is that there are absolutely no standardization or consistency between platforms.
Why in the name of all-things-good-in-this-world are axes in WPF and ASP.NET AJAX and ASP MVC and Windows Universal Apps not all called the same thing?
It would be very simple to use interfaces to create some consistency between platforms.
Even better would be if Model Views are shared across platforms in a portable library:
https://msdn.microsoft.com/en-us/library/hh563947(v=vs.110).aspx
https://msdn.microsoft.com/en-us/library/gg597391(v=vs.110).aspx
Regards,
Douw
PS. I could not find a feedback portal for all platforms, so have to log this multiple times.
1. Add method CategoricalErrorBarsBuilder.Field(string) that will indicate the name of the field containing the value for the error bar.  This value would be a relative difference (not absolute high/low).  There is a "Fields(string,string)" method but "Field(string)" for difference value is missing.

2. Provide way to render half (top or bottom) of error bar.  For example, if only CategoricalErrorBarsBuilder.HighField(string) is assigned, then render top half of error bar.  Or maybe some other setting.  Often it is desirable to show only the side of the error bar that is above (or below, if the bar represents a negative value) the bar marker so that the other half is not rendered within the bar marker.
01 @(Html.Kendo().Chart<Model>()
02	.Name("Donut_" + @customId)
03	.DataSource(dataSource => dataSource
04		.Custom()
05		.Type("aspnetmvc-ajax")
06		.Transport(transport => transport
07			.Read(read => read.
08				Action("Data_Read", "Data")
09			)
10			.Refresh(refresh => refresh.
11				Interval(5000)
12			)
13		)
14		.Events(events => events
15			.Error("onDonutError")
16		)
17		.Schema(schema => schema
18			.Data("Data")
19			.Total("Total")
20			.Errors("Errors")
21		)
22	)
23	.Series(series => { series
24		.Donut(
25			model => model.Value,
26			model => model.Description,
27			model => model.Color,
28			null
29		)
30	})
31	.Events(events => events
32		.SeriesHover("onDonutSeriesHover")
33		.Render("onDonutRender")
34	)
35 )
I would like to have an option to set an interval for refreshing the data in my chart (or any other control that uses a datasource). At this moment, I need to use the jQuery setInterval function to refresh the chart, but when using a dynamic range of controls, I don't want to write a refresh for every control on my page.
This can be done in two ways. First, a parameter in the wrapper that takes an int as value (for instance 5000 for 5 seconds). Second, an event that hooks into a JavaScript function, passing the id and type of the control. The first option is absolutely preferred (as shown in the code on line 10).
If you're declining this request, please advise on the best practice to handle this situation with regard to dynamic dashboards.