We were looking to use Telerik’s RadEditor control to provide MS Word like editing provision but lacks some features of MS Word especially Header & Footer options which will be repeated in every page, as the RadEditor control does not support paging. Are we doing it correctly? Is there an option where paging is supported and header and footer will come across pages? Are there any other products that support MS Word editor functionality?
Hello Progress team,
we're using the HtmlChart and RadialGauge components of your Telerik for AJAX suite and are encountering some inconsistencies between the two.
To be able to use the exportable SVGs of those components server-side, we've extended your classes and added two asp:HiddenFields each, so we can post the SVG and the dimensions back to the server for further processing. (Setting the values is handled in a button OnClientClick JavaScript function, that's irrelevant to this thread.)
As of 2019, when we first introduced the respective feature in our software, the code looked like this:
- Similar for both components
- In both cases the additional HiddenFields get added to the Controls-List "OnInit" before the base.OnInit-event.
- In both cases we had to override the "Render"-function to also render the HiddenField-Controls to the HTML.
public class ExportableRadHtmlChart : RadHtmlChart, INamingContainer
{
    private HiddenField _svgData = new HiddenField();
    private HiddenField _svgDimensions = new HiddenField();
    public ExportableRadHtmlChart()
    {
        _svgData.ID = "SVGData";
        _svgDimensions.ID = "SVGDimensions";
    }

    protected override void OnInit(EventArgs e)
    {
        Controls.Add(_svgData);
        Controls.Add(_svgDimensions);

        base.OnInit(e);
    }

    protected override void Render(HtmlTextWriter writer)
    {
        writer.RenderBeginTag(HtmlTextWriterTag.Div);

        base.Render(writer);

        _svgData.RenderControl(writer);
        _svgDimensions.RenderControl(writer);

        writer.RenderEndTag();
    }
}
and
public class ExportableRadRadialGauge : RadRadialGauge, INamingContainer
{
    private HiddenField _svgData = new HiddenField();
    private HiddenField _svgDimensions = new HiddenField();
    public ExportableRadRadialGauge()
    {
        _svgData.ID = "SVGData";
        _svgDimensions.ID = "SVGDimensions";
    }

    protected override void OnInit(EventArgs e)
    {
        Controls.Add(_svgData);
        Controls.Add(_svgDimensions);

        base.OnInit(e);
    }

    protected override void Render(HtmlTextWriter writer)
    {
        writer.RenderBeginTag(HtmlTextWriterTag.Div);

        base.Render(writer);

        _svgData.RenderControl(writer);
        _svgDimensions.RenderControl(writer);

        writer.RenderEndTag();
    }
}
With this code, we've been running the Telerik product version 2023.1.323.45.
Now, we've updated to Telerik product version 2025.1.416.462 and are experiencing the following inconsistencies:
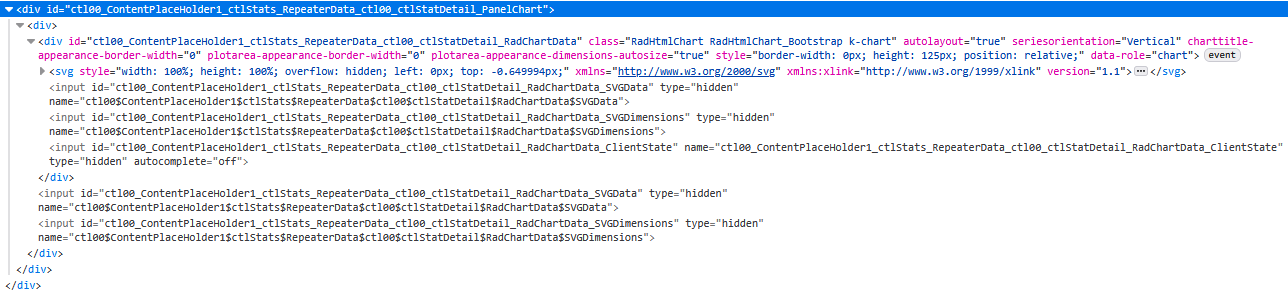
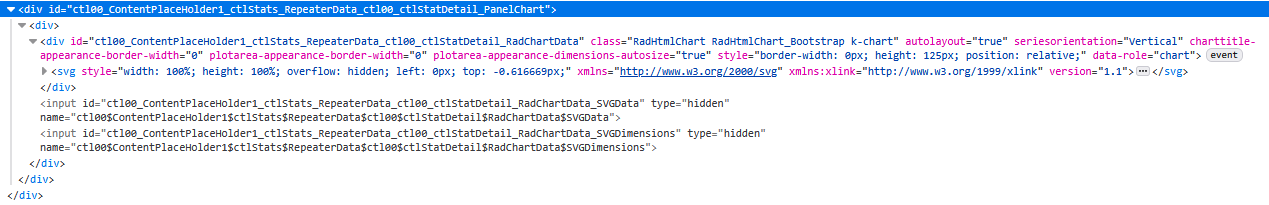
- Using the same code as before, the HiddenFields of class "ExportableRadHtmlChart" render twice:
Whereas previously, they've only rendered once:
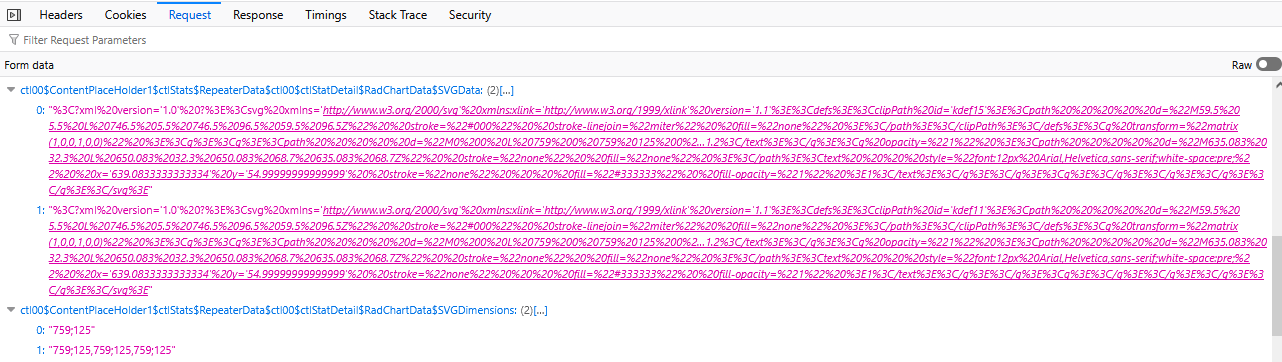
Removing the custom "Render"-function of the class "ExportableRadHtmlChart" resolves this issue. (Having duplicates of those HiddenFields actually causes issues on repeated PostBacks, as two HiddenFields at a time have the same ClientID and thus their values get packed as a comma separated list before transmission to the server, which in turn yields issues when parsing the SVG, which in reality are multiple comma separated SVGs.
The SVG values are truncated in this view, but the dimensions paint a pretty clear picture, as to what's happening here after 4 PostBacks.) Despite requiring to make this adjustment to our software, we're glad, we can discard that custom "Render"-function. - The "ExportableRadRadialGauge", on the other hand, still only renders the HiddenFields with the custom "Render"-function included. Can we expect a similar fix to the RadialGauge, s.t. we don't require to render the HiddenFields ourselves?
As I'm unsure of the "Theme name", I've put "ControlDefault". But I don't think that should matter too much. If it does, I'll try to find the correct value.
Kind regards,
Matthias
The Box Plot Chart throws the following errors when used:
RadHtmlChart.js:1 Uncaught ReferenceError: series is not defined
Uncaught (in promise) ReferenceError: series is not defined
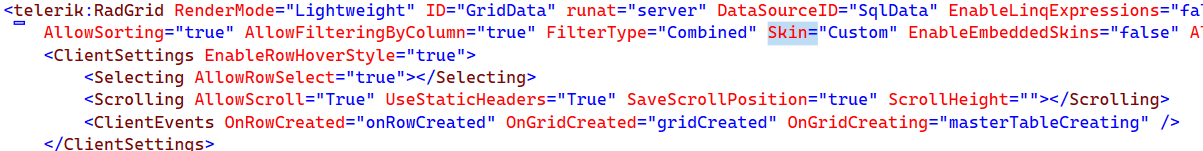
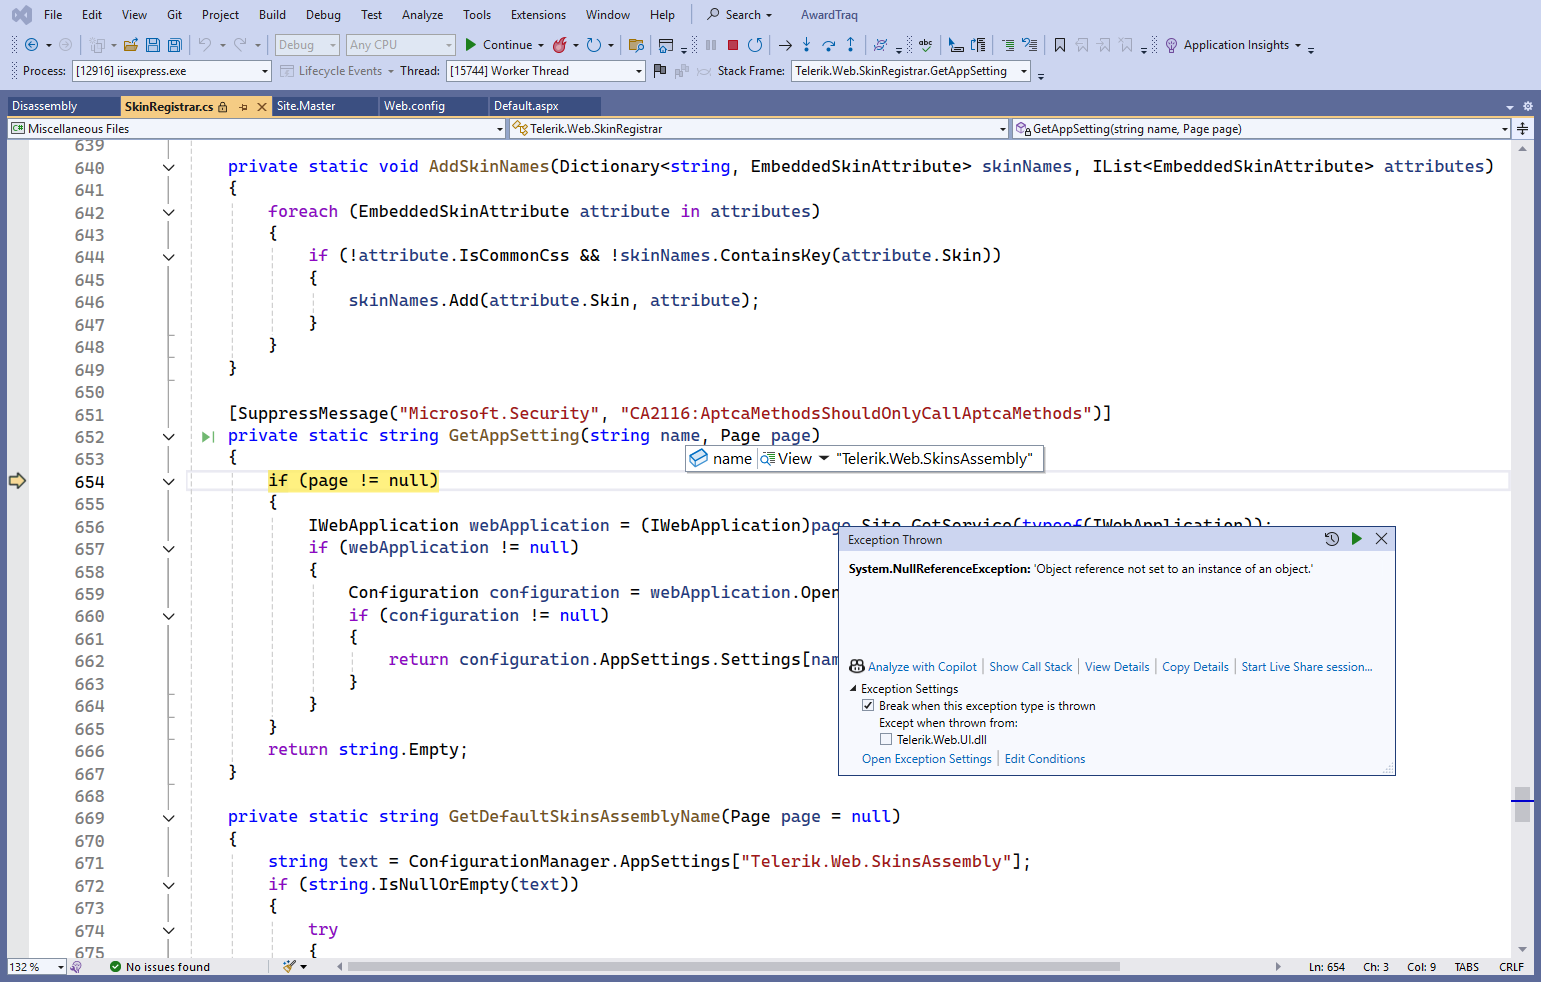
I recently upgraded the Telerik version from 2025.1.416 to 2025.3.825, and started getting this NullReferenceException during debugging.
I noticed I get the error when debugging RadGrid with the Skin property.
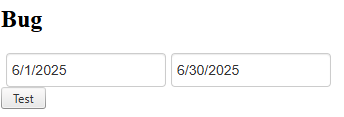
The problem is that when you click the buttons, the RadDateRangePicker is filled with the start of 2025-06-01 and the end of 2025-06-30. Then, when you click the button again, a change should occur in the RadDateRangePicker: start of 2025-07-01 and end of 2025-07-31.
1 step => correct
2 step => incorrect
Result
The first time you click the button, it returns the start date to 06/01/2025 and the end date to 06/30/2025 (this is correct). Clicking it again returns the start date to 06/30/2025 and the end date to 07/31/2025 (this is incorrect).
Work around
- Local page
js code fixed

const datepicker = $find('<%= radDateRangePicker2.ClientID %>');

datepicker.set_rangeSelectionStartDate(null);
datepicker.set_rangeSelectionEndDate(null);
- Global fixed All controls
C# in extension control
public bool EnableDateResetting
{
    get => ViewState["EnableDateResetting"] as bool? ?? false;
    set => ViewState["EnableDateResetting"] = value;
}

public eDateRangePicker() : base()
{
	Load += EDateRangePicker_Load;
}

private void EDateRangePicker_Load(object sender, EventArgs e)
{
    if (EnableDateResetting)
    {
        RegisterDateResettingScript();
    }
}

private void RegisterDateResettingScript()
{
	string script = $@"
		Sys.Application.add_load(function() {{
			const picker = $find('{ClientID}');

			if (picker) {{
				const origStart = picker.set_rangeSelectionStartDate;
				const origEnd = picker.set_rangeSelectionEndDate;

				picker.set_rangeSelectionStartDate = function(date) {{
					if (date !== null && !this._isResetting) {{
						const currentStart = this.get_rangeSelectionStartDate();
						const currentEnd = this.get_rangeSelectionEndDate();

						if (currentStart || currentEnd) {{
							this._isResetting = true;

							origStart.call(this, null);
							origEnd.call(this, null);

							this._isResetting = false;
						}}
					}}

					return origStart.call(this, date);
				}};

				picker.set_rangeSelectionEndDate = function(date) {{

					return origEnd.call(this, date);
				}};
			}}
		}});
	";

    ScriptManager.RegisterStartupScript(this, GetType(), $"DateResetting_{ClientID}", script, true);
}
ChatGPT recommended "Turn off Telerik’s “old” ARIA settings (they are overly strict and often invalid):"
i removed it and it worked. WTH?
What i supposed to do now? I added these settings in all our products
<telerik:RadGrid ID="grdImpacts" runat="server" EnableAriaSupport="true"style="margin-top:10px;margin-right:25px;margin-left:15px;"
ShowStatusBar="true" AutoGenerateColumns="False"
Width="650px" skin="WebBlue"
AllowSorting="False" AllowMultiRowSelection="False" AllowPaging="false"
OnNeedDataSource="grdMain_OnNeedDataSource">

Hello,
Thanks in advance
Yossi
Attached my grid code. Most columns are removed for readability
<telerik:RadGrid ID="grdChanges" runat="server" Width="1140"
skin="WebBlue" style="margin-top:13px; margin-right:13px; outline: 0 !important;"
ShowFooter="false" AllowSorting="false">
<ClientSettings>
<Scrolling AllowScroll="True" ScrollHeight="487px" UseStaticHeaders="true" />
</ClientSettings>
<MasterTableView GroupLoadMode="Client" AutoGenerateColumns="False" HeaderStyle-Font-Bold="true">
<HeaderStyle CssClass="InnerHeaderStyle"/>
<ItemStyle CssClass="InnerItemStyle"/>
<AlternatingItemStyle CssClass="InnerAlernatingItemStyle"/>
<CommandItemStyle CssClass="CommandHeaderStyle" />
<ColumnGroups>
<telerik:GridColumnGroup Name="Passenger Trips" HeaderText="Passenger Trips" HeaderStyle-HorizontalAlign="Center"/>
<telerik:GridColumnGroup Name="Ton Trips" HeaderText="Ton Trips" HeaderStyle-HorizontalAlign="Center"/>
<telerik:GridColumnGroup Name="Miles Per Trip" HeaderText="Miles Per Trip" HeaderStyle-HorizontalAlign="Center"/>
<telerik:GridColumnGroup Name="Miles Per Hour" HeaderText="Miles Per Hour" HeaderStyle-HorizontalAlign="Center"/>
</ColumnGroups>
<Columns>
<telerik:GridNumericColumn DataField="MilesPerHour_Proj" HeaderText="Project"
ColumnGroupName ="Miles Per Hour"
DataFormatString="{0:N1}" DecimalDigits="0"
HeaderStyle-HorizontalAlign="Center"
HeaderStyle-Width="60px" ItemStyle-BackColor="White"
ItemStyle-HorizontalAlign="Right" AllowRounding="true" />
<telerik:GridNumericColumn DataField="MilesPerHour_Base" HeaderText="Base"
ColumnGroupName ="Miles Per Hour"
DataFormatString="{0:N1}" DecimalDigits="0"
HeaderStyle-HorizontalAlign="Center"
HeaderStyle-Width="60px" ItemStyle-BackColor="White"
ItemStyle-HorizontalAlign="Right" AllowRounding="true" />
<telerik:GridNumericColumn DataField="MilesPerHourChange" HeaderText="Change"
ColumnGroupName ="Miles Per Hour"
DataFormatString="{0:N1}" DecimalDigits="0"
HeaderStyle-HorizontalAlign="Center"
HeaderStyle-Width="60px" ItemStyle-BackColor="White"
ItemStyle-HorizontalAlign="Right" AllowRounding="true" />
</Columns>
<NoRecordsTemplate>
<div style="padding: 5px">
No records available.
</div>
</NoRecordsTemplate>
</MasterTableView>
<FilterMenu EnableTheming="True">
<CollapseAnimation Duration="200" Type="OutQuint" />
</FilterMenu>
</telerik:RadGrid>
There is significant latency when a user has many images in a list or dropdown list, particularly those with sub-choices that also have images. Because of this, we tried implementing design-time templates to allow lazy loading of images for RadComboBox. While implementing a solution is possible, it was much more complicated than expected.
We have previuisly raised a feature request for simular controls that was fixed (Thanks for that) but our topp prioority component is The combobox. see Allow lazy loading of images with design-time templates for ListBox and ComboBox
During the discussion a few questions was rasied from telerik:
Currently, the ComboBox has the Load on Demand functionality which focuses on loading items as needed, but it does not specifically address lazy loading of images inside the templates. Before proceeding further, I’d like to confirm your current setup to suggest the best approach:
- Are you using server-side or client-side data binding with RadComboBox?
- Are you using design-time templates or injecting templates dynamically?
- How are images currently loaded in your ComboBox items?
- Is your main concern the initial load time, scrolling performance, or something else?
Reasons (Hope it makes sense)
Only server-side databinding (with both controls).
We are using both ItemTemplate with custom images (where we then control lazy loading ourselves) and ImageUrl where we lose this possibility and have issues. We also dynamically load custom controls (ITemplate) in a few places.
I'm using a RadTab and one of the RadPageViews starts with an RadAsyncUpload-Control. When I use arrow keys to select this tab and try to use the Tab-Key to focus the next element (the RadAsyncUpload in this case) nothing happens. If any other control (like a textbox) is placed above my upload control there is no problem focusing it.
You can see this in the attached Demoproject when using arrow keys to select to RpvUpload.