Unplanned
Last Updated: 18 Nov 2022 17:13 by Matthew
Created by: Matthew
Comments: 0
Category: Chart
Type: Feature Request
0
Add support for range series. The series are available in the native charts
Android - RangeBarSeries 
iOS RangeBar and RangeColumn Series
UWP RangeBar, Range Series.

Please add these series to Chart for Xamarin.Forms. 
Unplanned
Last Updated: 10 Jan 2022 09:29 by ADMIN
 Currently chart's horizontal axis is at the very bottom of the chart.


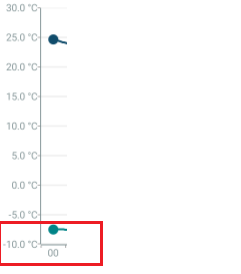
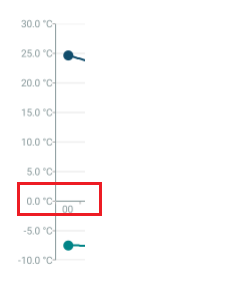
When there are negative values in the vertical axis, I want the horizontal axis to cross the vertical axis on 0


Unplanned
Last Updated: 04 Jun 2021 14:34 by ADMIN
Currently on iOS the PanOffset is reset when the underlying data is updated, while the same behavior is not observed on Android.
Unplanned
Last Updated: 03 Mar 2021 09:27 by ADMIN
Support the ability to apply palette (separate color) per point for a line series.
Unplanned
Last Updated: 17 Feb 2021 10:24 by ADMIN
Created by: Milos
Comments: 0
Category: Chart
Type: Feature Request
0
Provide an option to drag and drop chart annotations.
Unplanned
Last Updated: 17 Feb 2021 10:16 by ADMIN
Created by: Milos
Comments: 0
Category: Chart
Type: Feature Request
0
Provide an option to move (drag and drop) data points in chart control. 
Unplanned
Last Updated: 23 Nov 2020 08:58 by ADMIN
Created by: Marwen
Comments: 0
Category: Chart
Type: Feature Request
1
Rework the Series property of the Chart, so it can be consumed in the view model.
Unplanned
Last Updated: 18 May 2020 14:07 by ADMIN
Currently the ticks on the axis are calculated according to the Min and Max values as well as MajorStep in even intervals. We need to provide a way to set different intervals between the ticks.
Unplanned
Last Updated: 18 Mar 2020 12:55 by ADMIN
Created by: Mayank
Comments: 0
Category: Chart
Type: Feature Request
0
I want to create Drill-down charts in my xamarin.forms application. Please provide this functionality in Telerik UI for Xamarin Chart control. I want to drill-down from any type of chart to any type of chart for e.g Line chart can drill down to bar or pie chart.
Unplanned
Last Updated: 23 Jan 2020 14:20 by ADMIN
Created by: n/a
Comments: 0
Category: Chart
Type: Feature Request
1
Add support for funnel chart
Unplanned
Last Updated: 07 Apr 2020 08:53 by ADMIN

Using the RadPieChart and PieSeries (UI for Xamarin v2019.2.802.1 from NuGet), I can currently set the LabelBinding (or LabelFormat or LabelFormatter) to adjust the strings displayed in the labels on the slices of the pie chart, but unlike other chart controls, I currently have no way to modify the styling of those labels like I can in every other chart control I've used from Telerik UI for Xamarin.

It seems to me that it would be best to have more properties on the PieSeries class, like LabelFontSize, LabelFontAttributes, LabelFontFamily, LabelTextColor, and LabelMargin (Label prefix to distinguish from LegendTitleBinding could be kept or discarded as desired on some of these names).

LabelMargin would be particularly helpful to eliminate the UWP situation wherein currently all pie slice labels overlap with the outer lighter ring of the pie chart (see image from UWP).  The others just seem needed to maintain a consistent appearance of charts within an app - if all my chart labels are dark blue and a different font size and style except for the not-style-able black labels in pie charts, that makes pie charts hard to incorporate without looking bad or forcing styling elsewhere to match the pie charts' fixed values.

Unplanned
Last Updated: 23 Jul 2019 15:45 by ADMIN
Created by: Patrick
Comments: 1
Category: Chart
Type: Feature Request
0
Allow customers to set rotation of the labels of the separate bars in a similar manner as their format.
Unplanned
Last Updated: 12 Jun 2019 14:37 by ADMIN
In the case of multiple axes, provide the possibility to add a third y-axis in the middle of a RadCartesianChart.
Unplanned
Last Updated: 06 May 2019 13:05 by ADMIN
If the user pinches in the vertical direction, only the Y-Axis should zoom and the x-axis scale should remain the same.

If the user pinches in the horizontal direction, only the X-Axis should zoom and the y-axis scale should remain the same.
Unplanned
Last Updated: 25 Apr 2019 08:18 by ADMIN
Created by: Michael
Comments: 3
Category: Chart
Type: Feature Request
1

Hi there,


I would like to have support for selecting a slice of the piechart from code-behind. I have have looked into the chart and series properties but found no selectable datapoints property. The chartSelectionBehavior offers a ClearSelection method and the readonly SelectedPoints property, but nothing to add a selected point.


Unplanned
Last Updated: 27 Nov 2018 15:07 by ADMIN
Unplanned
Last Updated: 09 Nov 2018 09:26 by Michel
ADMIN
Created by: Stefan Nenchev
Comments: 1
Category: Chart
Type: Feature Request
7
In some cases, a redundant extra tick is drawn when using a DateTimeContinuousAxis. 
Unplanned
Last Updated: 06 Sep 2018 14:30 by ADMIN
Currently the labels are always positioned at the corresponding datapoint
Unplanned
Last Updated: 17 Sep 2018 14:41 by ADMIN
Created by: Carlos
Comments: 1
Category: Chart
Type: Feature Request
0
Provide the option to display text on arbitrary position - on the axis, on the data point, etc.
Unplanned
Last Updated: 13 Aug 2018 12:55 by ADMIN
ADMIN
Created by: Yana
Comments: 0
Category: Chart
Type: Feature Request
7
Currently the only way to apply different colors to the bars is through the ChartPalette. Provide an option to set the color according to the bound data item.  
1 2 3