DateTimeContinuousAxis displays incorrect labels when MajorStepUnit is Month. There are two labels for some months with 31 days.
When you zoom in on the graph, it always zooms to the center of the dataset. Even if I try to move, manually, horizontally the graph I lose the position when a point is added.
When point is added and chart is zoomed, cannot scroll to see other data, the chart reset the data visualization from the beginning.
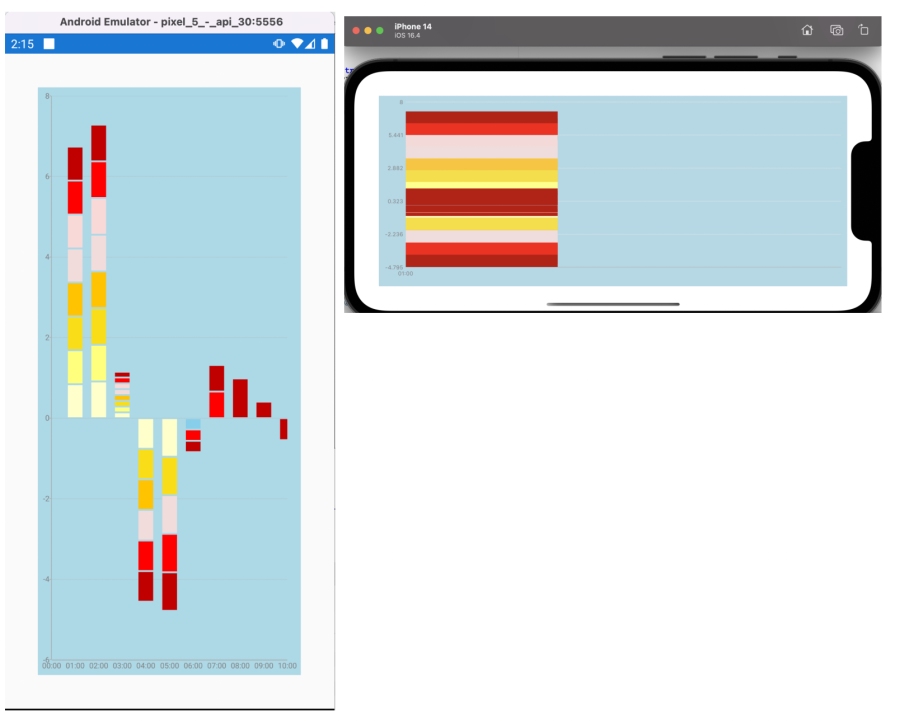
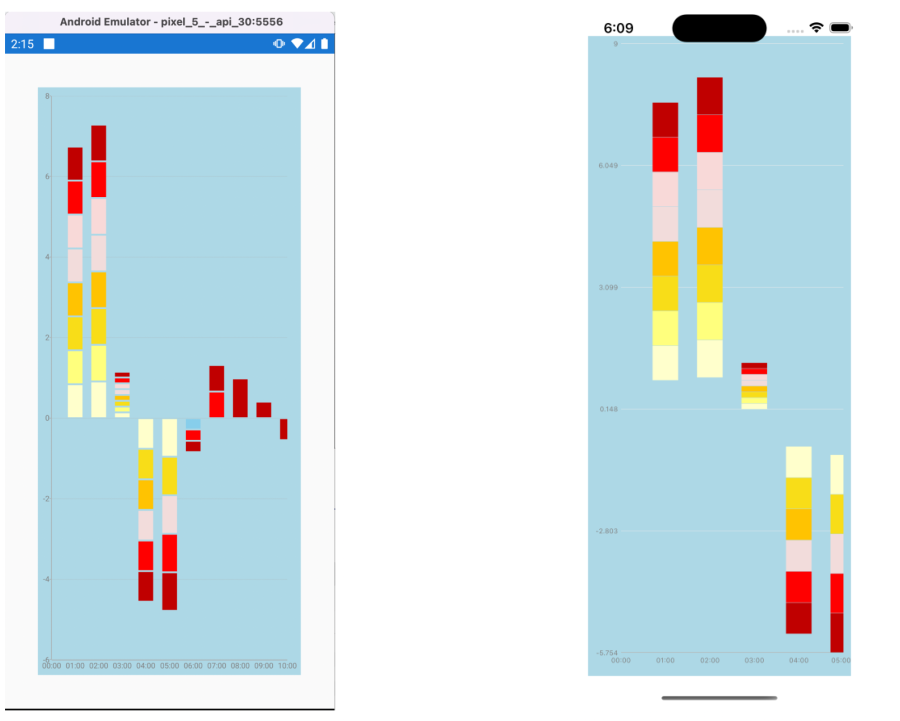
When having many stack bar series in one chart, some data points are rendered behind another data points. Check the attached image: how it looks on android and on iOS
When setting LabelTextColor, it does not apply to the chart axis
verticalAxis.LabelTextColor = Android.Graphics.Color.Red;
When having the following code on a button click
private void Button_Clicked(object sender, System.EventArgs e)
{
       this.chart.Zoom = new Size();
}
The chart zoom is reset first time, but when zooming again and pressing the button, the zoom level does not reset. You have to pan the chart, then zoom reset works.
This code resets the zoom:
private void OnResetZoomClicked(object sender, EventArgs e)
{
	this.chart.Zoom = new Size(1, 1); // This line is added as a workaround to reset the Zoom level
	this.chart.Zoom = new Size();
}
Android - RangeBarSeries
iOS RangeBar and RangeColumn Series
UWP RangeBar, Range Series.
Please add these series to Chart for Xamarin.Forms.
=> Observe the PieChart loads as expected
2. Change the selection back to "Bar Series"
=> Observe BarSeries continues to operate as expected
3. Change the selection from "Bar Series" to "Pie Series"
=> Observe the following exception
Java.Lang.NullPointerException: 'Attempt to read from field 'double com.telerik.widget.chart.visualization.pieChart.PieUpdateContext.radius' on a null object reference'
Workaround:
Remove the ShowLabels from Pie Series.
X-Axis labels are overlapped when new data points are constantly added.
on Android, the axis labels are replaced.
There is an inconsistency in the behavior on Android and iOS.
Workaround:
apply ChartPanAndZoomBehavior and set
PanMode to "Horizontal"
ZoomMode to "Horizontal"
And chart Zoom to "2,1"
<telerikChart:RadCartesianChart PaletteName="Light"
                                Zoom="2, 1">
    <telerikChart:RadCartesianChart.BindingContext>
        <local:ViewModel/>
    </telerikChart:RadCartesianChart.BindingContext>
    <telerikChart:RadCartesianChart.HorizontalAxis>
        <telerikChart:DateTimeContinuousAxis LabelFitMode="Rotate"
                                             MajorStepUnit="Day"
                                             PlotMode="OnTicks"
                                             LabelFormat="dd MMM"
                                             MajorStep="20"
                                             ShowLabels="True"/>
    </telerikChart:RadCartesianChart.HorizontalAxis>
    <telerikChart:RadCartesianChart.VerticalAxis>
        <telerikChart:NumericalAxis />
    </telerikChart:RadCartesianChart.VerticalAxis>
    <telerikChart:RadCartesianChart.Series>
        <telerikChart:LineSeries ValueBinding="Value"
                                 CategoryBinding="Date"
                                 DisplayName="Sales"
                                 ItemsSource="{Binding Data}"/>
    </telerikChart:RadCartesianChart.Series>
    <telerikChart:RadCartesianChart.ChartBehaviors>
        <telerikChart:ChartPanAndZoomBehavior ZoomMode="Horizontal"
                                              PanMode="Horizontal"
                                              HandleDoubleTap="True"/>
    </telerikChart:RadCartesianChart.ChartBehaviors>
</telerikChart:RadCartesianChart>
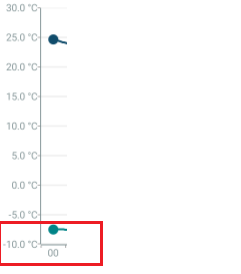
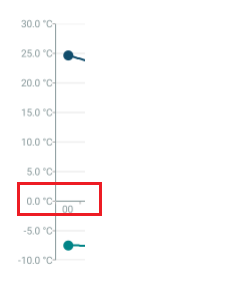
When there are negative values in the vertical axis, I want the horizontal axis to cross the vertical axis on 0
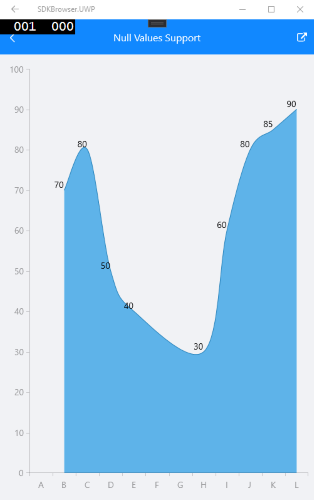
When rendering null values, there is inconsistency between the platforms. On Android and on iOS gap is displayed, on UWP the lines are connected:
Android:
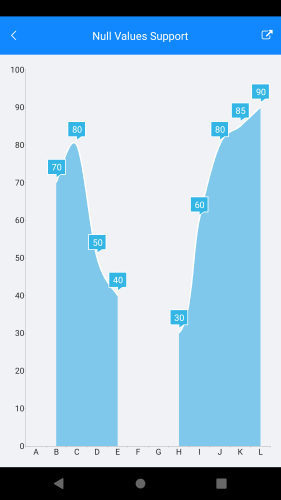
UWP:
Bar series disappear when applying zoom and then pan
The behavior can be reproduced in a horizontal bar series:
The vertical axis is categorical, and the horizontal axis is numerical
<telerik:RadCartesianChart.ChartBehaviors>
                <telerik:ChartPanAndZoomBehavior PanMode="Vertical"
                                                 ZoomMode="Both" />
            </telerik:RadCartesianChart.ChartBehaviors>
            <telerik:RadCartesianChart.VerticalAxis>
                <telerik:CategoricalAxis />
            </telerik:RadCartesianChart.VerticalAxis>
                <telerik:RadCartesianChart.HorizontalAxis>
                    <telerik:NumericalAxis Minimum="0"
                                       ShowLabels="True"
                                       LabelFormat="N0">
                    </telerik:NumericalAxis>
                </telerik:RadCartesianChart.HorizontalAxis>
                <telerik:RadCartesianChart.Series>
                <telerik:BarSeries CategoryBinding="Category"
                                        ValueBinding="Value"
                                        ItemsSource="{Binding Data}" />
            </telerik:RadCartesianChart.Series>
Workaround:
Replace the axis:
Use categorical axis for the horizontal axis and numerical axis for the vertical axis
I am using Telerik RadCartesianChart to display 5 different series. As per requirement, I need to use a secondary vertical Axis for the 5th series. I followed https://www.telerik.com/forums/multi-axes-chart-xamarin-ios to achieve that. But if I bind data after a delay then it's not working for iOS.
Steps:
1. Bind series data after delay.
For more details please refer attached files.
I look forward to your reply!
Regards,
Ajay Dodiya | Sr. Xamarin Developer