Currently, if you create a custom DraggingService of RadDiagram and override the drag methods (StartDrag, Dragging, etc.), the corresponding drag events stop reporting if you don't call the base method implementation. Add protected methods like OnDragging and OnStartDrag that raise the corresponding events. This will allow the developer to manually raise the events if the drag method overrides are implemented from scratch, without calling the base implementation.
In the meantime, you can use custom events like so:
public class CustomDraggingService : DraggingService
{
    public event EventHandler<PositionChangedEventArgs> CustomDraggingEvent;


    public CustomDraggingService(IGraphInternal graph) : base(graph)
    {
    }

    public override void Drag(Point newPoint)
    {
        CustomDraggingEvent?.Invoke(this, new PositionChangedEventArgs(new Point(), newPoint, null));
// custom implementation here
    }
}
Instead, we could change this behavior to raise an exception, which will not be caught when a custom type, which is not allowed, gets de-serialized.
The middle point in this context is a point that is located on the line segment that is positioned after the middle length of the line. Add a property on the RadDiagramConnection class that returns the middle point. The property should be DependencyProperty so it can be bound with OneWayToSource mode in order to be able to notify the bound view model (if such is presented).
Currently, you can get this information by combining the CalculateMiddlePointOfLine and AllPoints methods of the ConnectionUtilities class.
var allConnectionPoints = Telerik.Windows.Diagrams.Core.ConnectionUtilities.ConnectionUtilities.AllPoints(radDiagramConnection);
var startAndEndPoints = new Tuple<Point, Point>(radDiagramConnection.StartPoint, radDiagramConnection.EndPoint);
Point middlePoint = Telerik.Windows.Diagrams.Core.ConnectionUtilities.CalculateMiddlePointOfLine(startAndEndPoints, allConnectionPoints);
Currently, the print preview control provides only options for the current printer, the page orientation and the page size . Include the following options too:
- Paper Format (Lettre, A4, etc.)
- Paper Orientation (Portrait or Landscape)
- Number of copies (1, 2, 3, ...)
- Print Color Settings (Colors or Monochrome)
- Margins
- Resolution (DPI based on the capabilities of the printer)
Add a RotationAngle property or a Rotate() method or something similar that will automatically update the rotation of the ManipulationAdorner along with the shapes inside.
Add an option to modify the StartPoint and EndPoint properties of RadDiagramConnection instances via the SettingsPane.
This functionality can be achieved by modifying the default ControlTemplate of the SettingsPaneView element to include an additional RadTabItem instance in the RadTabControl element. In the additional RadTabItem, input controls can be used, such as the RadNumericUpDown element. These elements should modify properties that will be present in a custom LinkViewModelBase<NodeViewModelBase>> class. More specifically, the X and Y properties of the StartPoint and EndPoint properties of the RadDiagramConnection element.
The attached sample project shows the implementation of the above approach for achieving this requirement.
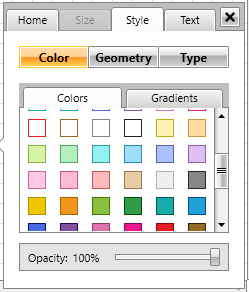
Add an option to customize the available colors in the SettingsPane control:
Implement support (or extensibility) for printing the whole diagram in a single page.
Throw a more descriptive error that tells the concrete reason. In this case, the issue relates to the wrong TargetType of the Style.
To reproduce the error, it is enough to add a container node (ContainerNodeViewModelBase<NodeViewModelBase>) in the graph source and then to add a ContainerShapeStyle with a wrong TargetType. For example, use a type of Button.
Currently large diagrams are hard to export with good quality because of the memory limitation in WritableBitmap when the DPI is increased.

 -- One option is to use BitMapCacheBrush (discussed here http://www.telerik.com/forums/low-resolution-using-exporttoimage-on-big-diagram)

 -- Another option is to export multiple images of the diagram which cover it all. Then possibly combine these pictures into one.

 -- Also , you can try increasing the operating memory of your Visual Studio
Currently, the content of RadDiagramShape element alignment can be changed via its HorizontalContentAlignment and VerticalContentAlignment. However, in RadDiagramTextShape, those properties don't take effect. Instead the text content is always centered.
At this point, you can achieve this requirement, by extracting the ControlTemplate of RadDiagramTextShape and bind the corresponding properties of the ContentPresenter to the parent shape. For example:
<ContentPresenter x:Name="NormalContent"
				  Margin="{TemplateBinding Padding}"
				  HorizontalAlignment="{TemplateBinding HorizontalContentAlignment}"
				  VerticalAlignment="{TemplateBinding VerticalContentAlignment}"/>
I looked at the RadDiagram options, but it doesn't have anything that compares to a circular relationship chart. Here's an example:
https://www.codeproject.com/KB/silverlight/342715/screenshot2.png
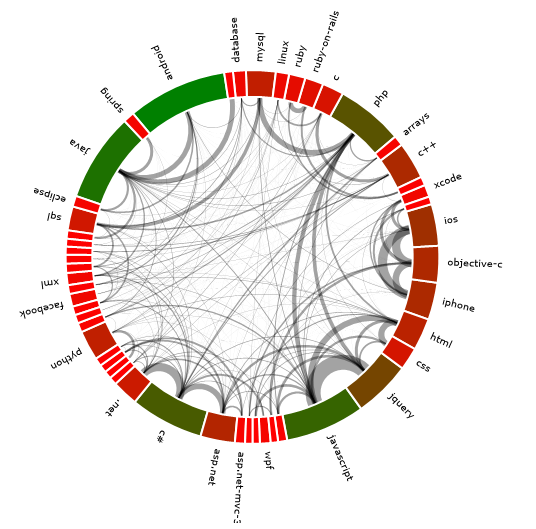
Part of this article:
https://www.codeproject.com/Articles/342715/Plotting-Circular-Relationship-Graphs-with-Silverl
I gave some thought at trying to rewrite the code into WPF, but I've got too many other irons in the fire. Figured I'd ask as this sort of visualization control doesn't appear in your current collection. I have a project that could benefit from displaying weighted relationships in such a manner, but my choices are either do something sub-par with the RadDiagram option, write one myself, find another controls collection and port everything, or leave the feature out for now. I'm going for the leave it out option for the moment, and see if your UI wizards can come up with something...
Just as a use case, one of the reasons for wanting this is to diagram conversations between individuals in email messages. Being able to show who's talking to whom and how frequently using one of these charts for visualization allows you to quickly find patterns...