
Severity: Sev2 (High)
Test Environment: OS: Windows 11 22H2
OS Build: 23620.1000
Pre-Requisite: Set browser zoom level to 400% and display resolution: 1280x1024 (or) In dev Tools set the resolution to 320*256.
Repro steps:
1.Open URL: http://www.telerik.com/kendo-ui in edge browser.
2.Navigate to 'Kendo UI for Angular ' tab item and invoke it.
3.Navigate to the Angular chart control and invoke it.
4.In left navigation pane click Scatter control under 'series types'.
5.Navigate to 'Scatter Plot Chart'.
6.Verify whether X-axis is getting overlapped while resizing the page upto 400% of zoom or not.
Actual Result:
X-axis is getting overlapped while resizing the page upto 400% of zoom.
Expected Result:
X-axis should not get overlapped when browser zoom level set to 400%.

Hello ,
Kindly Have issue with stacked bar when try to draw two items in chart with specified with as the below
<kendo-chart-series>
  <kendo-chart-series-item type="bar" [stack]="{ type: '100%' }" [data]="[97]">
  </kendo-chart-series-item>
  <kendo-chart-series-item type="bar" [stack]="{ type: '100%' }" [data]="[7]">
  </kendo-chart-series-item>
</kendo-chart-series>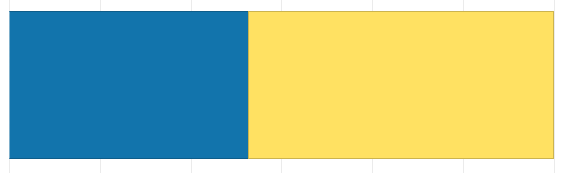
Can Anyone help on that ?

Hi,
This documentation Stackblitz demo is broken (see screenshot below for details).
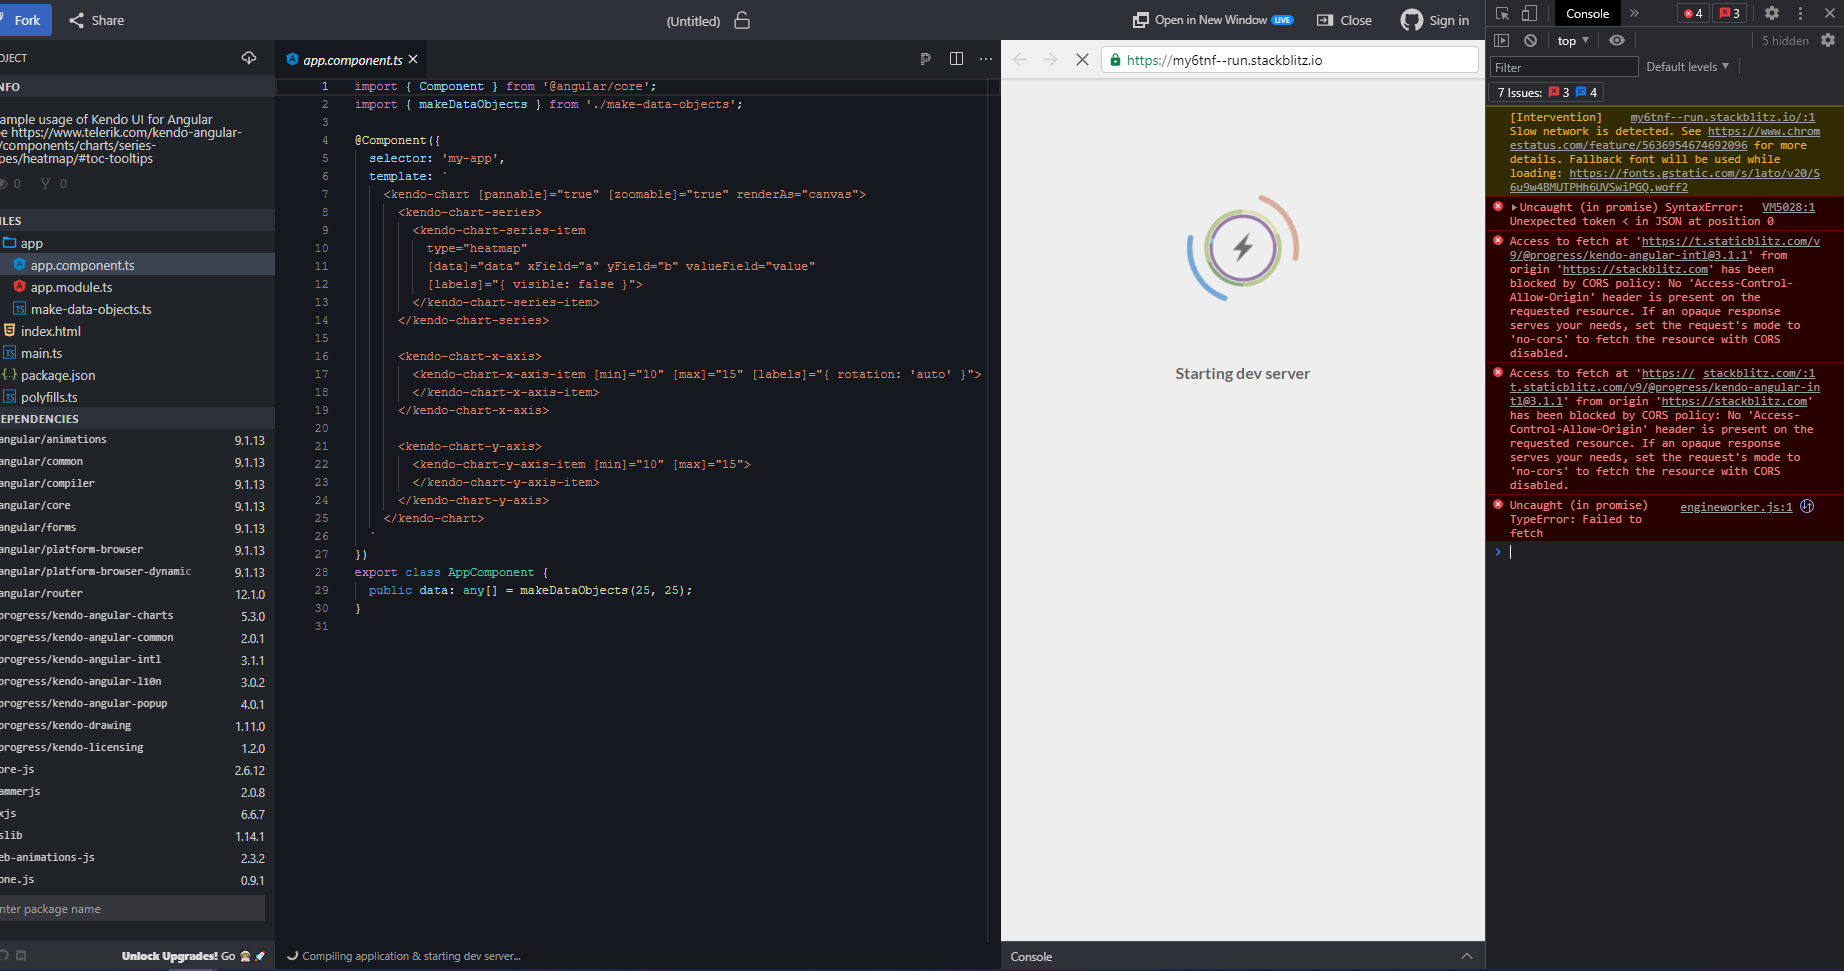
Expected: Clicking on an item in the legend is supposed to toggle it's visibility.
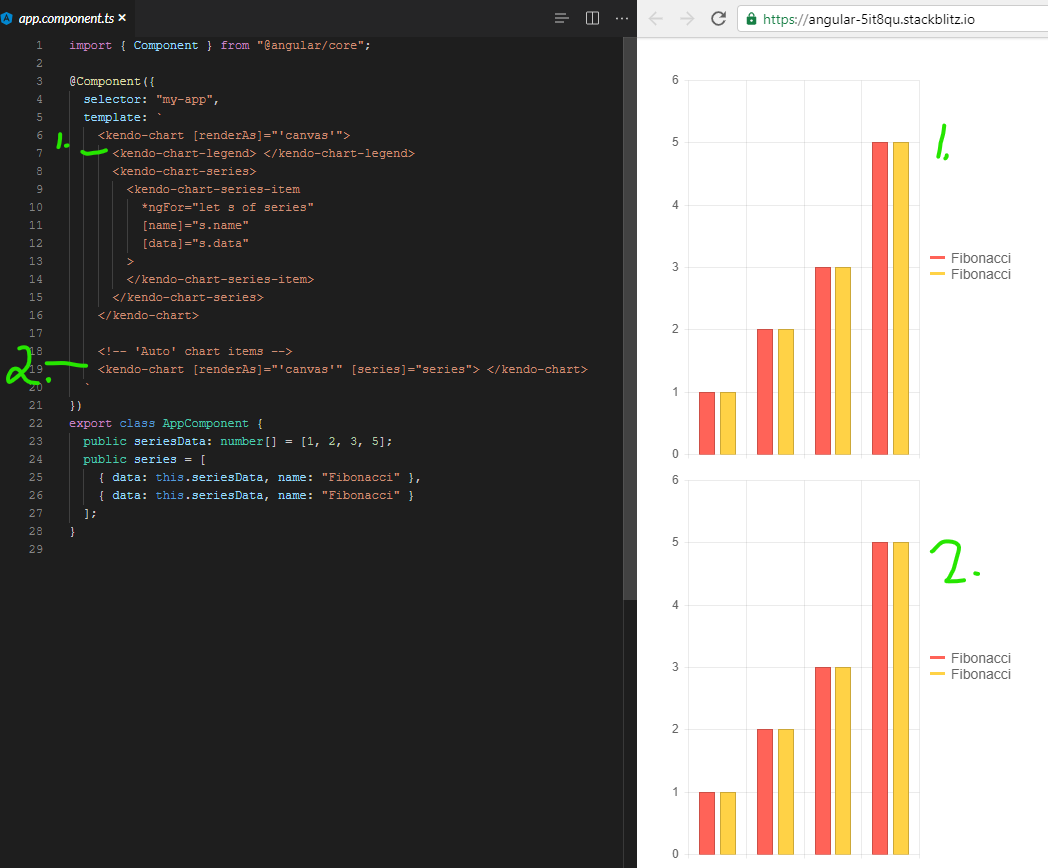
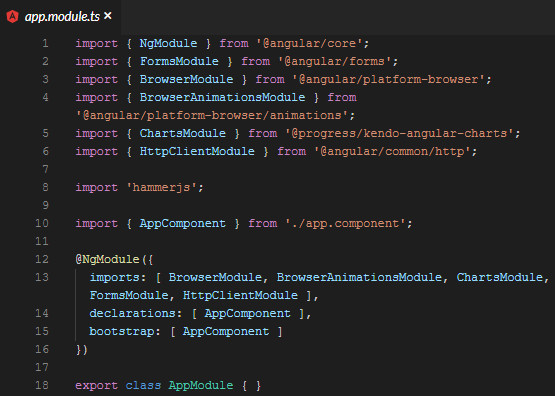
Using kendo-angular-charts 5.1.0, if you add a series input, this does not happen. A full, minimal reproduction of this issue is available At the StackBlitz link below. The top chart has no issues (hides series upon clicking) while the bottom does.
https://stackblitz.com/edit/angular-5it8qu?file=app%2Fapp.module.ts
Screenshots of above repro:
It appears that there is a line deep in the codebase that says:
const seriesComponent = this.seriesComponents.get(index);
if( !seriesComponent ){ return; }
seriesComponent.toggleVisibility();
And the seriesComponents array is empty when you use the [series] binding.
We even went so far as to bind to the legend click event and toggle the visibility myself, but it is 100% ignored.
It was something like:
public onLegendClick(event: LegendClickEvent){
  event.series.visibility = !event.series.visibility;
  event.source.refresh();
  event.source.changeDetector.markForCheck();
}
Calling refresh did redraw the chart, but it was still visible/enabled. Even though digging into it with ng.getComponent on the kendo-chart, and looking at the series, it clearly showed series[0].visible to be false.
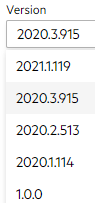
I had to make an assumption on version for this ticket since the dropdown on the bug report doesn't list 5.1.0. I wouldn't mind tips on understanding how to match up your marketing version name with your npm version. I spent 20 minutes looking around for that, but your versioning doc and release history don't seem to have anything about the actual version numbers used by package management.
Describe the bug
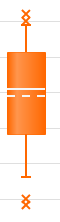
The <kendo-chart-series-item> component is missing settings for median and mean elements rendered by Box Plot series.
These are the two lines within each box (dashed line is mean):
Expected behavior
These series elements should be customizable and should accept an object containing color, width, dashType and opacity.